
A systematic approach to stock pattern detection that scans 6,000+ stocks daily — so you don't have to.
Finding high-probability stock setups before they break out comes down to three things: scanning the entire market instead of a short watchlist, scoring every setup with the same objective criteria so bias does not creep in, and acting inside the narrow one to three day window before the crowd piles in. No manual process covers 6,000 NYSE and NASDAQ stocks consistently, which is the real reason most traders find setups too late rather than too early. Below I explain the approach, and the system I built to run it every trading day.
This is Part 1 of a two-part series on building an automated stock screening system for breakout detection. Here, we'll explore the problem most technical traders face and how algorithmic pattern recognition solves it. In Part 2, we dive into the technical architecture, the 16 bullish chart patterns we detect, our scoring methodology, and the engineering challenges we overcame to process 6,000+ stocks every trading day.
The Problem Every Technical Trader Faces
For years, I watched the stock market while managing teams at Amazon and raising kids. I tried every stock screener, followed gurus, subscribed to newsletters. The result? I lost as much as I gained.
Why? By the time I found the setup, it had already moved.
I needed something different: a system that analyzes the 6,000+ stocks traded on NASDAQ/NYSE daily and surfaces the 10–20 best opportunities before they are likely to break out. Not after. When I finally had time to build it, friends and colleagues asked if I'd share the results. That's how StockDataAnalytics.com was born, an automated stock breakout detection system built for busy investors who don't have hours to scan charts. The system uses stock pattern recognition as the main strategy.
Why I Built an Algorithmic Stock Pattern Detection System
I've spent my career at the intersection of data and technology. I started as a business analyst and financial analyst, then led software development teams at Amazon where I learned to build systems that process massive datasets at scale. For the past 15 years, I've led data engineering organizations of well known technology companies, most recently managing teams of up to 75 engineers building data platforms that handle billions of records daily.
The drawback of management? Less hands-on technical work. I started StockDataAnalytics.com partly to scratch that engineering itch, but also because I knew I could build the stock breakout scanner I'd always wanted.
Why Now? The Technology Stack Finally Exists
Cloud computing enables scanning thousands of stocks daily at scale with no limit on complexity. Modern data pipelines handle complex price adjustments and pattern scoring in real time. And algorithmic pattern recognition has matured far beyond what any individual trader could replicate manually.
More importantly, the retail trading landscape has changed. Platforms like Robinhood democratized access, but they didn't democratize analysis. Everyone can trade. Few can consistently find an edge. That gap, between having access and having insight, is exactly what automated stock screening fills.

Why Most Traders Miss Breakouts: It's Timing, Not Knowledge
Picture this: Sunday afternoon, you're scanning charts. You spot a perfect bull flag on a stock you've been watching and plan to act on it Monday morning. Then life happens such as a new deadline at work, a kid gets sick, a last-minute business trip.
Wednesday, you remember your plan. You pull up the chart and the breakout has already happened. The stock is up 8%.
Now what? Chase it into strength? That's a terrible risk/reward. Wait for a pullback? It never comes. Watch it run another 15%? Painful.
This isn't a knowledge problem. It's an execution problem. And it's the single biggest reason retail traders underperform: they find the right setups too late to act on them.
The Real Bottleneck: Finding Patterns Before the Crowd
The real bottleneck in technical trading is finding chart patterns early enough to matter in that narrow 1–3 day window when the setup is complete, the breakout is imminent, but the crowd hasn't piled in yet.
Miss that window and you're either too early (buying consolidation and enduring chop) or too late (chasing momentum with poor risk/reward).
There are 6,000+ actively traded stocks on the NYSE and NASDAQ. Even the best traders can only scan a fraction manually. That's why most retail traders miss breakouts, not from lack of skill, but from human limits:
- We get tired and inconsistent across a long watchlist.
- We rationalize and see what we want to see.
- We spot patterns that aren't really there.
We're wired for pattern completion, not pattern consistency. That's great for spotting faces in crowds. It's terrible for consistent stock trading.
What Actually Works: Systematic Stock Pattern Detection at Scale
Technical chart patterns work because they reflect supply and demand: real shifts in buying and selling pressure visible in price action. But here's the thing: every trader has access to the same charts, the same tools, and the same information.
The edge isn't in knowing more. The edge is in executing better and faster.
Execution edge means finding bullish patterns early, before the breakout runs. It means scoring them consistently, without cognitive bias. It means acting decisively, without hesitation.
You can't do this manually, not across 6,000 stocks, and not consistently day after day. That's why I built StockDataAnalytics.com as an algorithmic stock screening platform.
Our system detects 16 distinct bullish chart patterns across four categories:
- Continuation patterns: setups like Bull Flags and Ascending Triangles that signal a trend is likely to resume
- Candlestick patterns: short-term reversal signals confirmed by volume
- Reversal patterns: formations indicating a potential trend change at key support levels
- Volatility patterns: tightening price ranges that often precede explosive breakouts
Each pattern is scored across three dimensions — structure quality, volume confirmation, and breakout readiness — to rank the highest-probability setups each morning. We'll explore each pattern and the scoring methodology in detail in Part 2.
What You Get: Pre-Market Stock Breakout Alerts With Complete Trade Plans
We designed StockDataAnalytics for busy professionals who want to invest actively in the stock market but lack time for hours of chart analysis. Every trading day, you receive curated stock recommendations before the market opens scored, ranked, and ready to act on.
What Each Stock Recommendation Includes
Every recommendation provides:
- Clear entry zone with position sizing suggestion
- Defined stop loss — the price level where the pattern invalidates
- Price targets with visualized risk/reward ratio
- Pattern quality score and confidence level
- Key catalyst — why this setup matters right now
- Full technical context — trend direction, sector strength, and relative performance
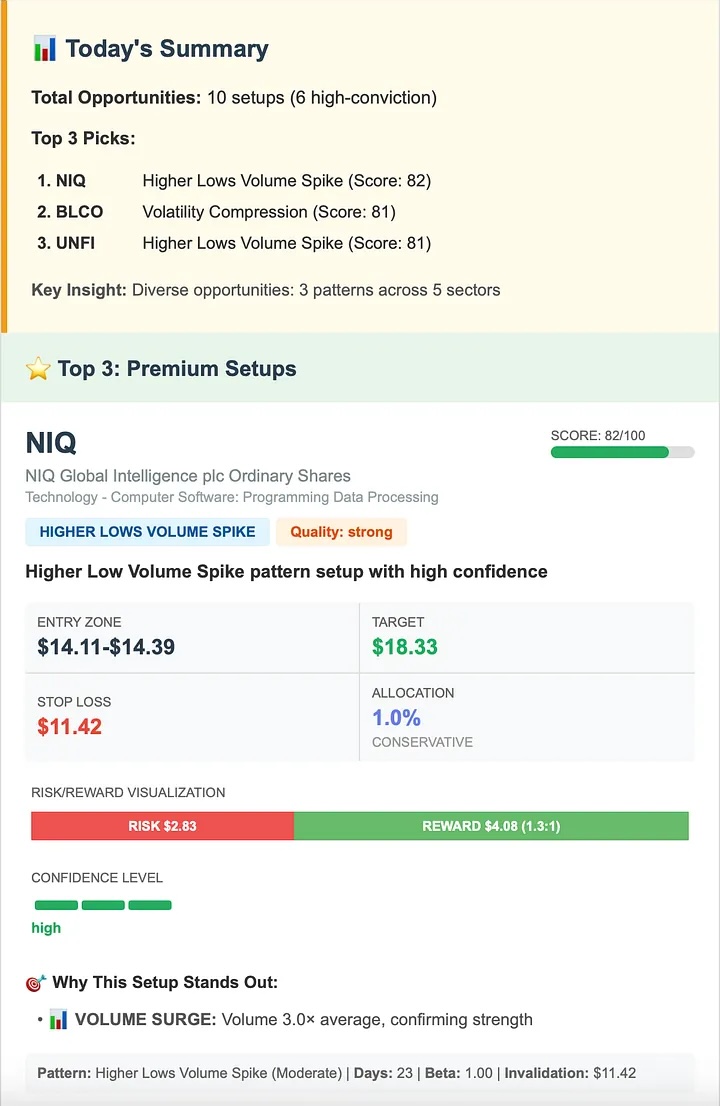
This isn't vague commentary. It's a complete trade plan you can evaluate and execute in minutes. Go here to learn more about how to interpret our emails.
Your Morning Routine as a Subscriber
Here's what a typical morning looks like:
6:00 AM ET: Your email arrives with today's top stock breakout opportunities, pre-ranked by pattern quality score.
6:05 AM: Over coffee, you review the 3–5 highest-scored recommendations.
6:15 AM: You pick 1–2 setups that fit your strategy and risk tolerance.
9:30 AM (market open): You execute entries using the provided entry zones and set stop-loss orders at the specified levels.
Weekly, you review the performance data we publish and see which pattern types are working best in current market conditions.
Total time investment: less than 30 minutes per day.
The Execution Edge: Why Automated Stock Screening Outperforms Manual Analysis
What we're delivering isn't tips or hunches. It's execution edge, the combination of speed, scale, and objectivity that no manual process can replicate.
- Comprehensive: We scan every actively traded stock on NYSE and NASDAQ, every day. Nothing slips through.
- Consistent: The same scoring criteria apply Monday through Friday. No fatigue, no bias.
- Fast: Pattern alerts arrive before the market open, in the actionable window.
- Objective: No emotion, no rationalization. Just data-driven pattern detection.
- Accountable: We track prediction quality and measure the impact of every algorithm adjustment.
- Quality: We continually look for opportunities to improve our current detectors or to develop new detectors, keeping up with market trends.
Unlike traditional stock screeners that surface patterns after they've already moved, our system catches them in the 1–3 day window when they're still actionable, before the crowd piles in.
Current performance: 57% of our top-50 daily recommendations beat the market over one-week holding periods. Our target: 75%.
Who This Stock Breakout Scanner Is For
Our system is built for a specific type of investor:
You're a good fit if you understand (or want to learn) technical chart patterns, can act on opportunities within the trading session, practice disciplined risk management with stop losses, and prefer systematic, data-driven processes over gut feelings. You have the time and commitment to manage your trading account daily.
This isn't for you if you're a buy-and-hold investor who checks a portfolio monthly, daily pattern alerts won't match that approach. It's also not for anyone seeking "guaranteed winners", pattern-based trading is probabilistic, and losses are part of the process. And it's not for passive traders who can't act within a day or two. Our recommendations work best when executed promptly.
We're a precision tool, built for doers.
Our Commitment: Radical Transparency Over Marketing Hype
We're building this in public. That means you'll see:
- Real performance data published weekly — no cherry-picking winners
- Honest reporting on which patterns are working and which need refinement
- Open methodology discussion and continuous improvement documentation
- Pattern-level performance breakdowns so you can evaluate what works for your strategy
You'll see our wins and our losses. You'll see us refine detection algorithms when patterns underperform. You'll see our methodology evolve as we learn what works in live markets.
No marketing fluff. No cherry-picked trades. Just honest, data-driven reporting and systematic improvement.
Common Questions
How do I find stock breakouts before they happen?
Scan the whole market every day rather than a watchlist, score each setup the same way, and act in the one to three day window before the move. Doing that by hand across 6,000 stocks is the part that breaks down, which is why I built StockDataAnalytics to run the scan and scoring automatically and email the results before the open.
Is there a service that emails daily stock breakout alerts before the market opens?
Yes. StockDataAnalytics scans roughly 6,000 NYSE and NASDAQ stocks every trading day for sixteen bullish patterns, scores each detection, and emails the highest-conviction setups at 6:00 AM ET. Each pick includes an entry zone, a stop loss, a target, and the pattern quality score behind it.
How is this different from a normal stock screener?
Most screeners surface patterns after they have already moved. This system is built to catch them in the one to three day window before the breakout, while the setup is still actionable. It also scores every detection on structure, volume, and breakout readiness so the list is ranked, not just filtered.
Who is StockDataAnalytics for, and who is it not for?
It is built for casual investors making short-term, multi-day holds who can act within the trading session and practice disciplined risk management. It is not a fit for buy-and-hold investors who check a portfolio monthly, for anyone expecting guaranteed winners, or for passive traders who cannot act within a day or two.
What does it cost?
We are offering three pricing plans for each market supported (NASDAQ and NYSE at this point). Our most popular tier offers 10 daily recommendations at $19.95, a smaller plan at six daily recommendations costs $9.95 and our larger plan at 20 daily recommendations costs $29.95. All numbers are quoted at monthly subscription costs.
Important Risk Disclosures
StockDataAnalytics.com provides technical analysis and pattern recognition signals for educational and informational purposes. We are not registered investment advisors, and nothing on this platform constitutes financial advice.
Past performance does not guarantee future results. All trading involves risk of loss, including loss of principal. Pattern-based trading can result in consecutive losses. You are responsible for your own trading decisions and risk management. Our recommendations are based on technical analysis only and do not consider your personal financial situation, risk tolerance, or investment objectives.
Before acting on any recommendation, conduct your own research and consider consulting with a qualified financial advisor. Never risk more than you can afford to lose.
Get Started: Free Early Access to Automated Stock Breakout Alerts
You don't have to buy our service right away. Feel free to try it first here. This will allow you to try the service for free for two weeks. You will receive ten recommendations for each (NASDAQ and NYSE) on every trading day. We won't ask for a credit card until you are ready to subscribe permanently.
The Bottom Line
Breakout patterns are forming right now — in dozens of stocks across the market while you read this. The question isn't whether opportunities exist. The question is whether you have a system to find them before the crowd does.
I built StockDataAnalytics because I was tired of missing setups I should have caught. If you've ever felt that same frustration, scanning charts on Sunday only to watch your picks run on Tuesday without you, this tool is for you.
Two-Week free Trial (10 stocks daily for NYSE and NASDAQ each). No credit card required.
In Part 2, we'll explain exactly how our algorithmic stock screening system works, the 16 bullish patterns we detect, our three-dimensional scoring methodology, and the engineering challenges we solved to make this possible.