Blog
Insights & Analysis
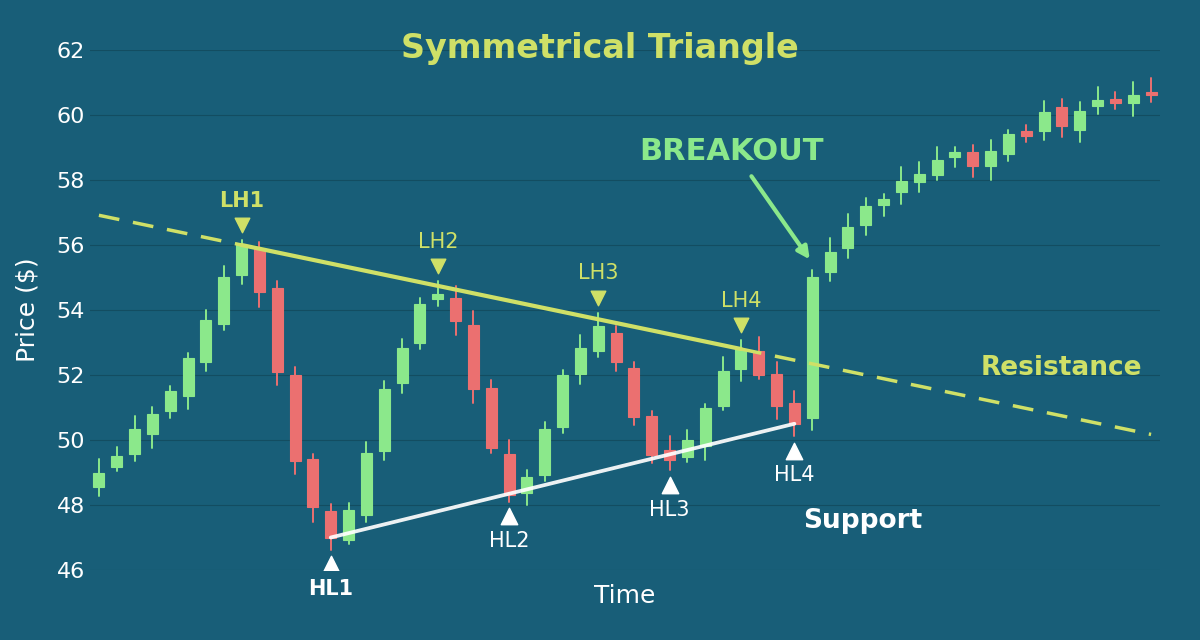
Symmetrical Triangle Pattern Win Rate: 39,000-Trade Analysis
Symmetrical triangle win rate is 50.7% unfiltered. After analyzing 39,000 trades, see the filters that lift it to 70% and the textbook rules that fail.
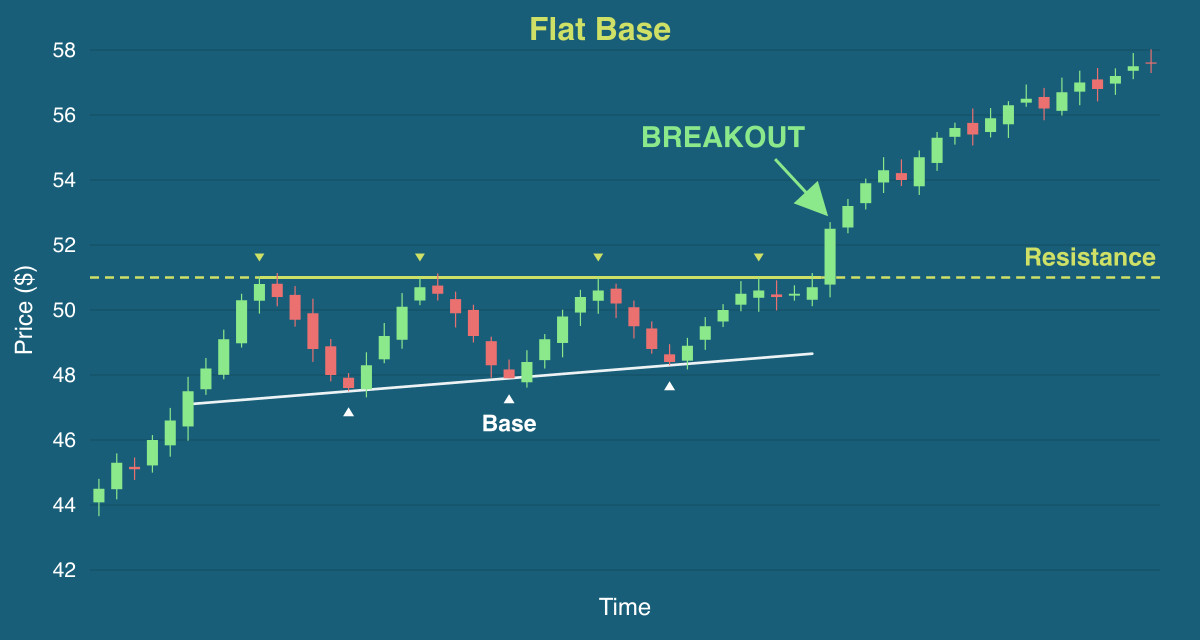
Flat Base Pattern Win Rate: 34,000-Trade Analysis
What is the flat base pattern’s win rate? Across 34,312 trades: 89% in low-confidence bull markets vs 62% in strong bull: the CANSLIM rule inverted.
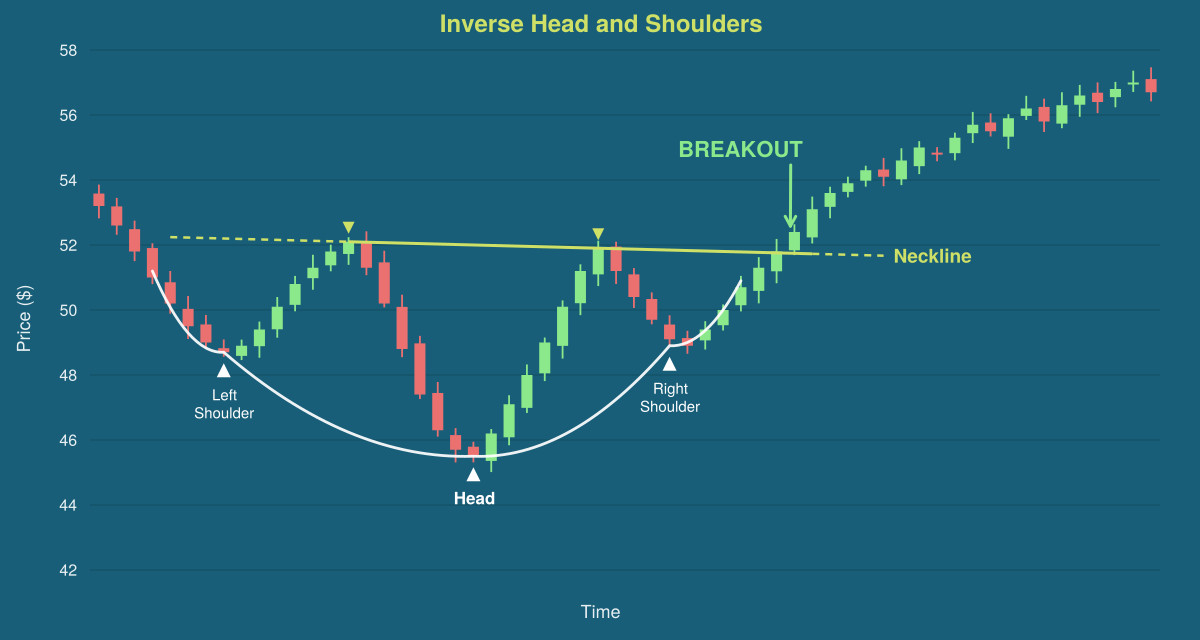
Inverse Head and Shoulders: 67,041 Trades Show What Actually Works
How often does the inverse head and shoulders work? Across 67,041 trades: 85% on clean breakouts, 43% after throwbacks, far from the textbook 89%.

What Predicts Stock Breakouts? 370,000 Chart Patterns Analyzed.
After analyzing 370,000 chart patterns, textbook-perfect setups underperformed imperfect ones and volume direction beat volume magnitude. Full data inside.

7 Chart Patterns Ranked by Real Performance: 370K Detections Exposed the Winners
Most chart pattern guides recycle the same textbook theory. We ranked 7 essential patterns using 370,000 real detections across 6,000+ stocks, and the results challenged conventional wisdom. See which patterns actually beat the market and which underperform despite their popularity.
Do Chart Patterns Work in 2026? What the Data Shows
After analyzing 370,000+ pattern detections, we discovered something that contradicts most technical analysis guides: the patterns that look perfect consistently underperform. When a pattern is obvious to everyone, the edge disappears.

Chart Pattern Backtesting Results: What We Learned from 370,000 Detections
Chart pattern backtesting results from 370,000 detections: textbook-perfect patterns underperform. Our stock pattern scanner reveals why imperfect ascending triangles, deep rounding bottoms, and moderate volume spikes beat conventional technical analysis and how to find them systematically.
Why We’re Showing You Win Probability Instead of Just Scores
New email format delivers daily stock recommendations with backtested win probability, market regime analysis, and trade levels including entry zone, stop loss, and target price. Pattern quality and risk/reward scores help traders evaluate NYSE and NASDAQ picks in under five minutes.
How We Increased Our Stock Pattern Detection Accuracy from 51% to 65%
Learn how Stock Data Analytics improved stock pattern detection accuracy from 51% to 65% market beat rate. Discover proven backtesting methods, technical analysis validation techniques, and machine learning rigor that separate profitable breakout signals from noise. Our data-driven approach to stock

The Chart Pattern Quality Paradox: 370,000-Trade Analysis
370,000 chart pattern detections analyzed. Textbook-perfect setups hit targets 29% of the time. Messier patterns hit 60%. Here's what actually predicts breakouts.