Blog
Insights & Analysis
Beyond Pattern Detection
Stock pattern detection alone isn't enough—realistic entry prices, stop losses, and profit targets determine trading success. Learn how beta-adjusted returns and volatility-adaptive trade levels using Average True Range (ATR) transform technical analysis into actionable recommendations. Discover why
6 Things We Learned from 24,603 NYSE Breakouts
Analysis of 24,603 NYSE breakouts reveals key trading patterns: 34 daily breakout opportunities, 63% completing within 7 days, and 31% average price movement. Discover seasonal trends—March favors short positions while November leads bullish breakouts. Health Care and Finance sectors deliver highest
November’s Biggest Stock Winners: What We Caught, What We Missed, and Why
Case study analyzing November 2025's biggest stock winners reveals how systematic trading filters work. Learn why volatility compression patterns in HAE and SD were detected late, how risk/reward ratio requirements protect capital from chasing breakouts, and why filtering penny stocks prevents portf
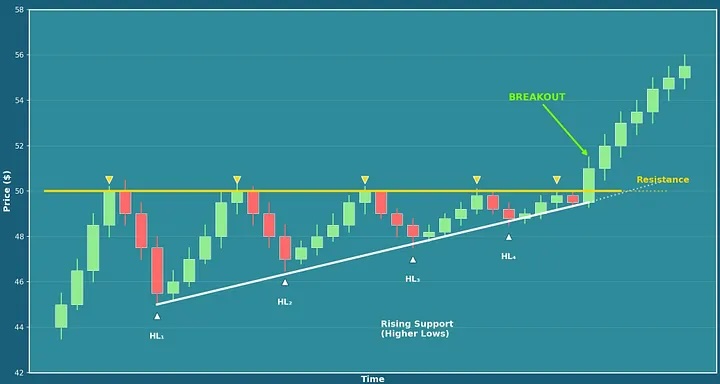
Ascending Triangle Pattern: 81.6% Win Rate Detection Method
Our ascending triangle detection algorithm achieved an 81.6% market beat rate across 49 stocks in a single week. Here's how our three-dimensional scoring system evaluates structure, volume, and breakout readiness to identify high-probability ascending triangle breakouts across 6,000+ stocks ...
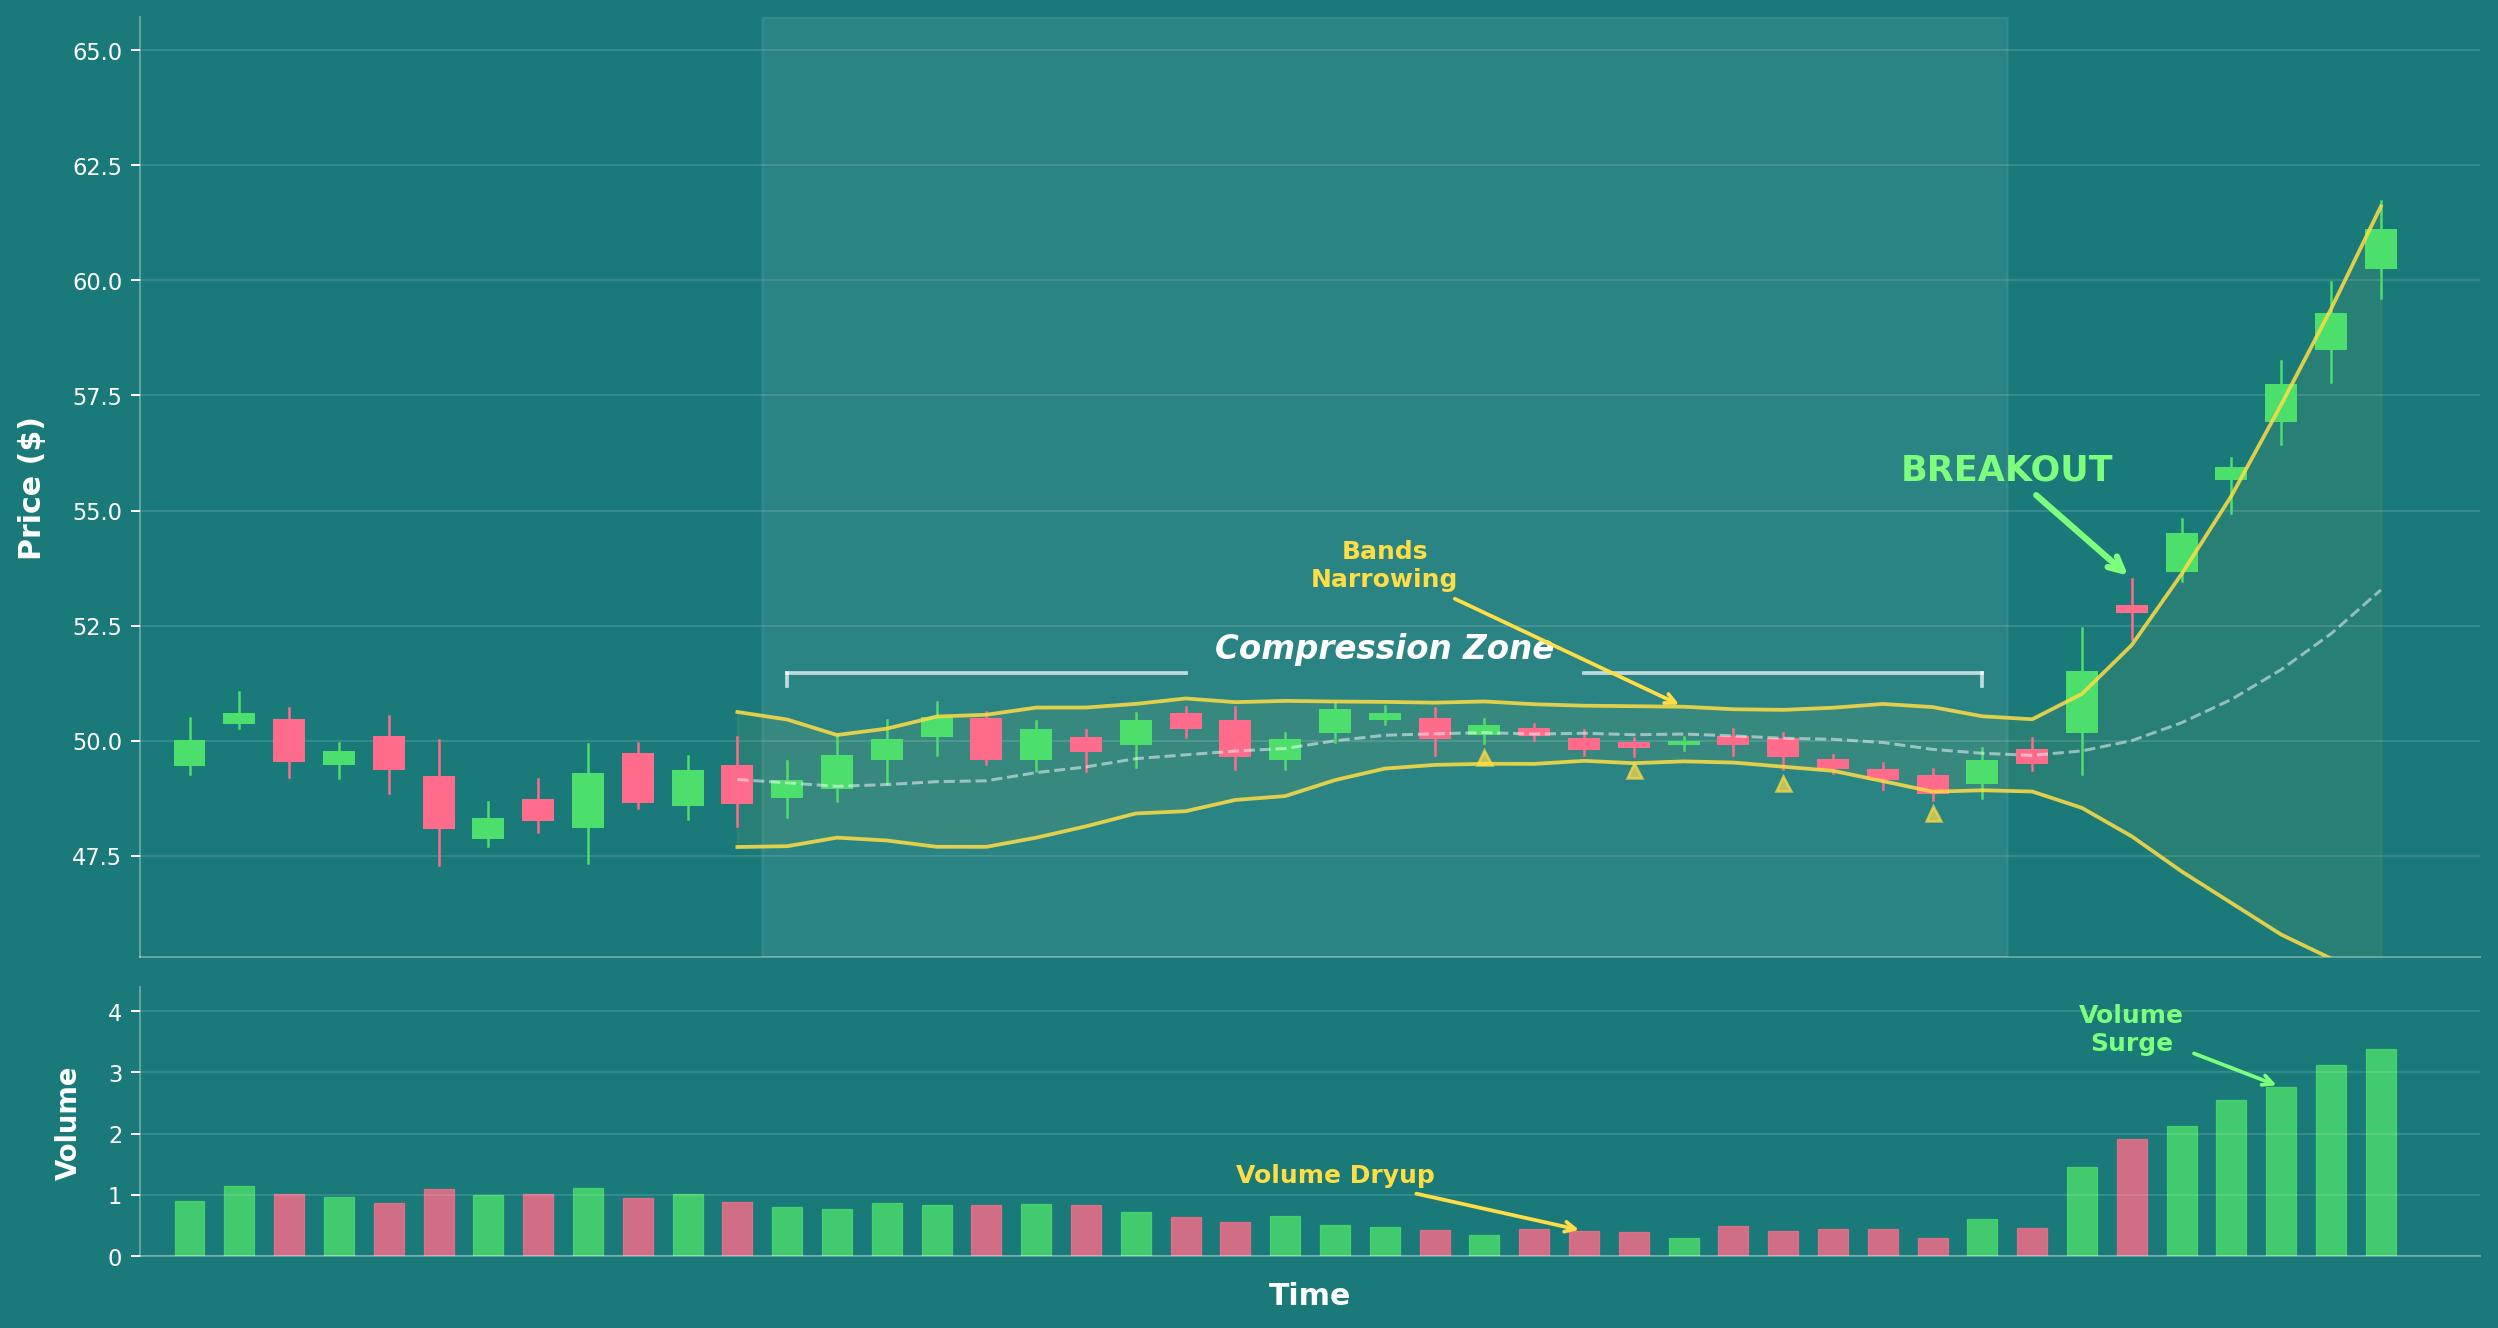
Volatility Compression: Why This Breakout Pattern Beats the Market 63% of the Time
After analyzing 370,000+ pattern detections, volatility compression emerged as our strongest performer. Here's how Bollinger Band squeezes and volume dryups signal breakouts before they happen, and the scoring approach that separates real setups from false signals.

How to Find High-Probability Stock Setups Before They Break Out (Part 2)
Learn how our systematic stock pattern detection system scans 6,000+ NASDAQ and NYSE stocks daily to identify 16 bullish breakout patterns using a three-dimensional scoring methodology — before the market opens.

How to Find High-Probability Stock Setups Before They Break Out
This is Part 1 of a two-part series on building an automated stock screening system for breakout detection. We'll explore the problem most technical traders face and how algorithmic pattern recognition solves it. In Part 2, we dive into the technical architecture, the 16 bullish chart patterns ...