Blog
Insights & Analysis
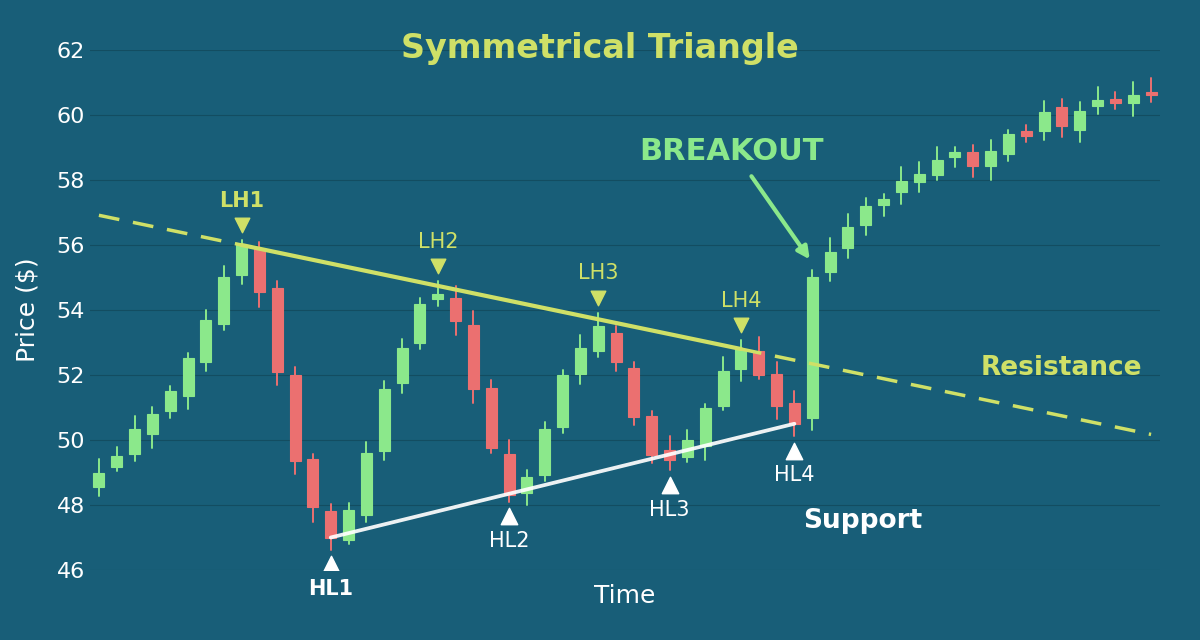
Symmetrical Triangle Pattern Win Rate: 39,000-Trade Analysis
Symmetrical triangle win rate is 50.7% unfiltered. After analyzing 39,000 trades, see the filters that lift it to 70% and the textbook rules that fail.
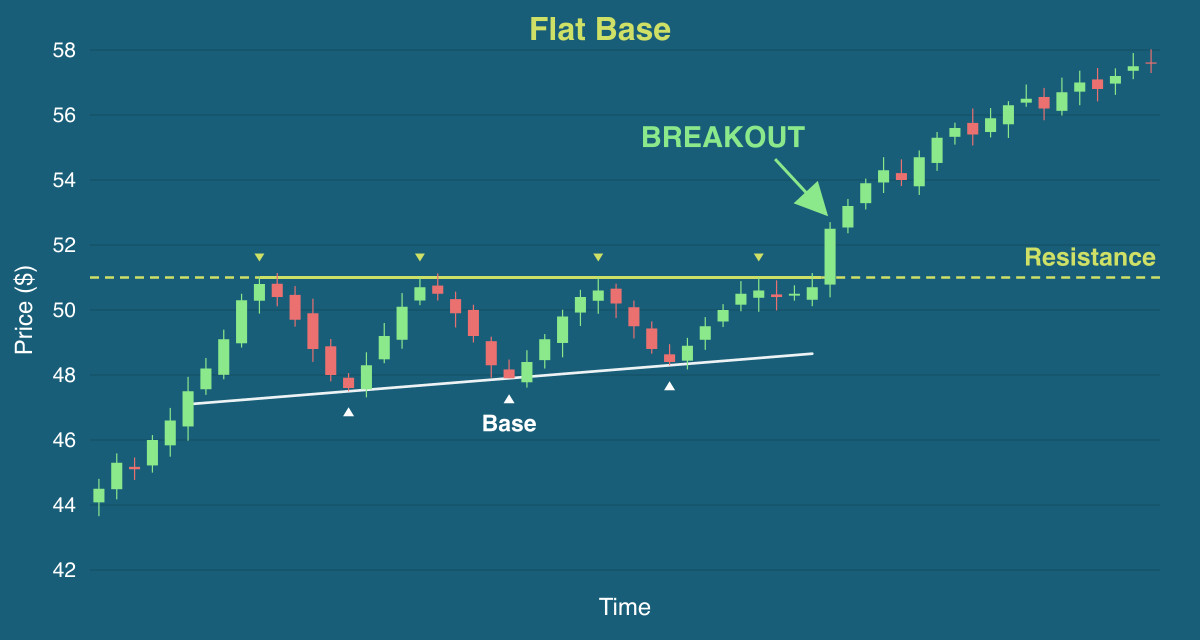
Flat Base Pattern Win Rate: 34,000-Trade Analysis
What is the flat base pattern’s win rate? Across 34,312 trades: 89% in low-confidence bull markets vs 62% in strong bull: the CANSLIM rule inverted.
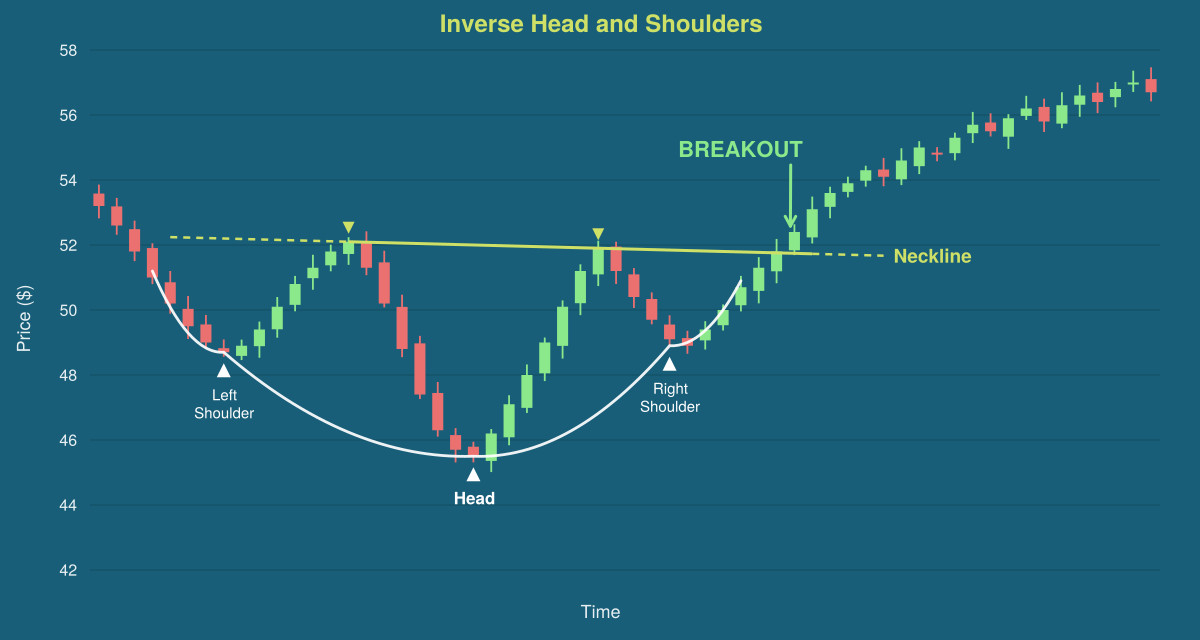
Inverse Head and Shoulders: 67,041 Trades Show What Actually Works
How often does the inverse head and shoulders work? Across 67,041 trades: 85% on clean breakouts, 43% after throwbacks, far from the textbook 89%.

7 Chart Patterns Ranked by Real Performance: 370K Detections Exposed the Winners
Most chart pattern guides recycle the same textbook theory. We ranked 7 essential patterns using 370,000 real detections across 6,000+ stocks, and the results challenged conventional wisdom. See which patterns actually beat the market and which underperform despite their popularity.
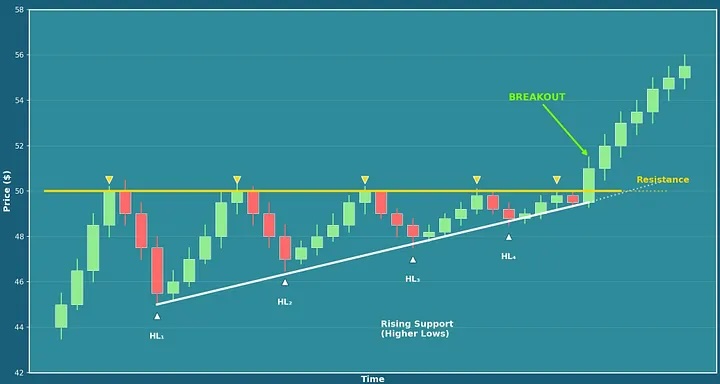
Ascending Triangle Pattern: 81.6% Win Rate Detection Method
Our ascending triangle detection algorithm achieved an 81.6% market beat rate across 49 stocks in a single week. Here's how our three-dimensional scoring system evaluates structure, volume, and breakout readiness to identify high-probability ascending triangle breakouts across 6,000+ stocks ...
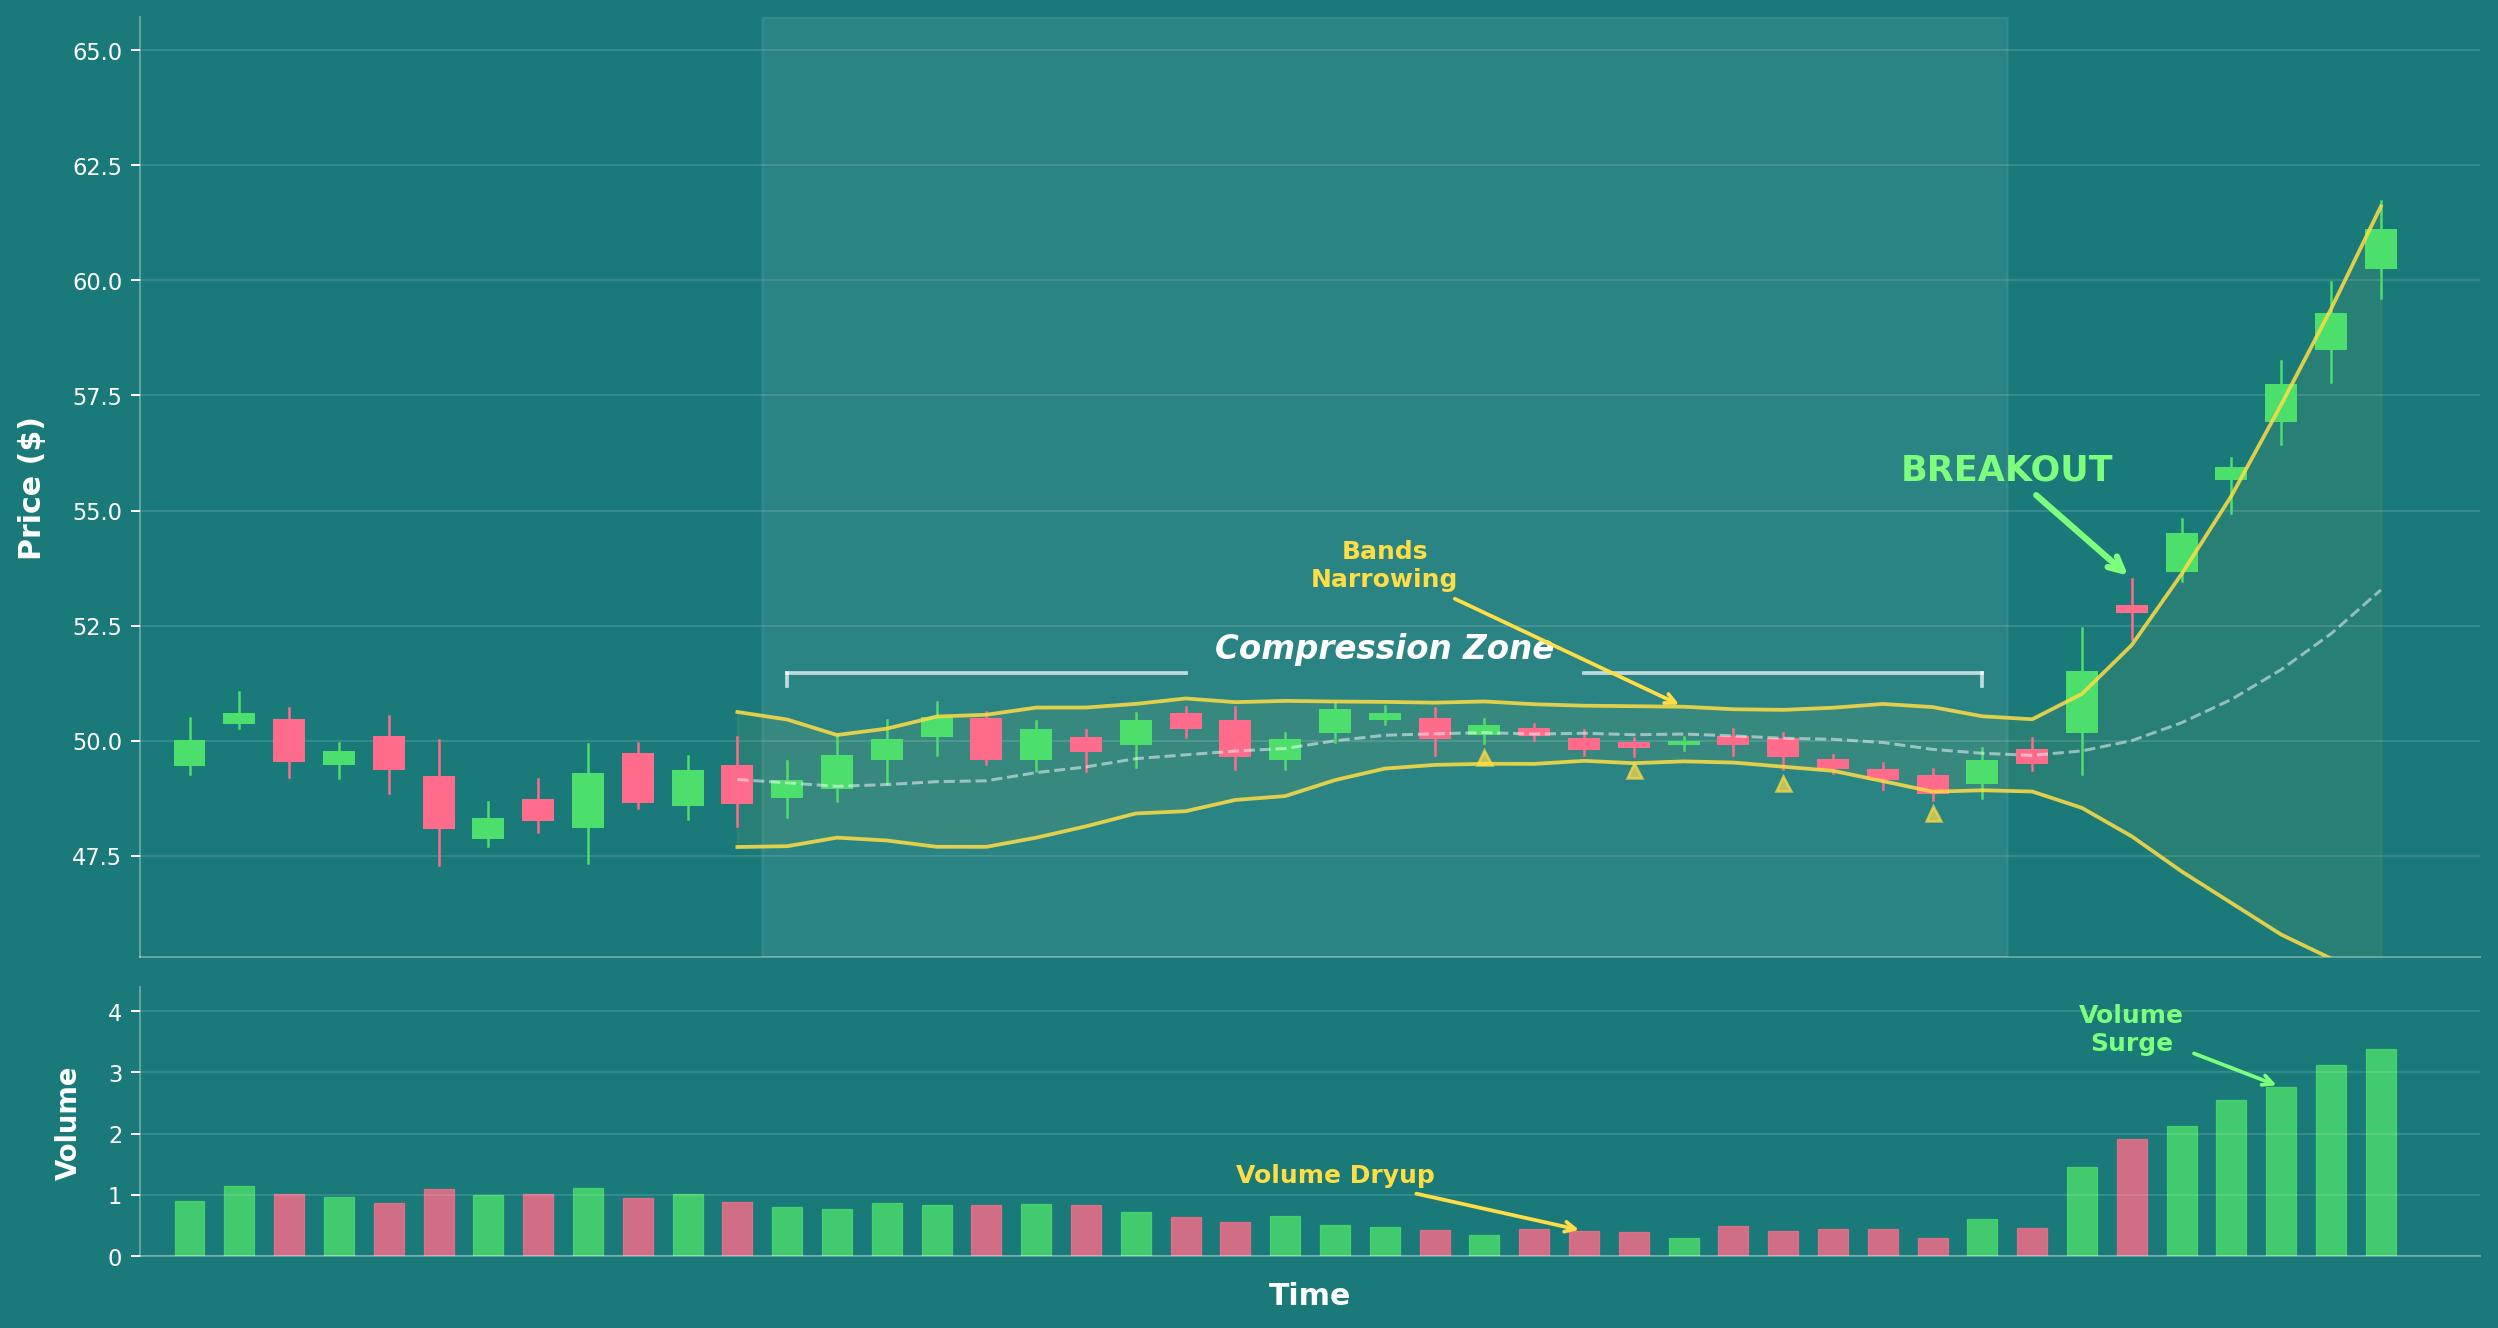
Volatility Compression: Why This Breakout Pattern Beats the Market 63% of the Time
After analyzing 370,000+ pattern detections, volatility compression emerged as our strongest performer. Here's how Bollinger Band squeezes and volume dryups signal breakouts before they happen, and the scoring approach that separates real setups from false signals.