The pattern everyone teaches and almost nobody measures
The Inverse Head and Shoulders pattern succeeds 43% of the time when price retests the neckline after the breakout (a throwback), and 85% of the time when it doesn't. That's the finding from 67,041 completed trades we tracked across a systematic daily scan of 6,000+ stocks. It sits a long way from the 89% success rate that Bulkowski's encyclopedia made the textbook number.
The pattern is one of the most widely taught bullish reversals in technical analysis, but almost no published source offers segmented performance data on it. The pictures look clean. The rules sound simple. The success stories make it onto YouTube thumbnails. What almost none of those sources offer is data that distinguishes the setups that work from the setups that don't.
How often does the pattern actually win? Which setups are worth taking and which should you avoid? Where does it work, where does it fail, and how should a swing trader execute the trade?
I run StockDataAnalytics.com, where we scan roughly 6,000 stocks every trading day looking for sixteen bullish chart patterns and track what happens to each detection afterward. Our backtest now contains 67,041 completed Inverse Head and Shoulders detections. This article walks through how they performed, and ends with a few concrete filters that the data supports. You can find samples of our Inverse Head and Shoulders detections here.
The unfiltered pattern is barely better than random
The first thing the data shows, and the part that surprises almost everyone, is that the Inverse Head and Shoulders pattern without any quality filter is not a strategy. It is a coin flip. Across the lowest tier of detections in our scan (the ones scoring around 20) we tracked 5,180 trades. The win rate landed at 47.2%. The market beat rate was 43.5%. The average return per trade was essentially zero. Move up to a quality score of 25 and the picture barely changes. The win rate ticks to 50.9%. Market beat rate to 47.4%. Average return is just slightly positive.
This is what most published studies of the pattern look like, because most studies aggregate every detection into a single bucket and report the average. The average is unimpressive because it mixes the setups that work with the much larger pool of setups that do not. A trader who walked into the lowest-quality half of these patterns blindly would have a portfolio that paid for commissions and would perform about the same as the broader market.
That is the floor. It is also the credibility check on everything that follows. The edge comes from identifying statistical markers that separate high-quality patterns from the rest. For context, I will run you through the scoring methodology first, before we dive into the data. The scoring system evaluates each detection across three dimensions and creates a composite score ranging from 0 to 40 with 40 being the best possible score, identifying high-quality setups.
Structure (up to 15 points): Structure is the geometry of the pattern itself: the shape on the chart and how convincing it is. The score rewards a head that is genuinely deep relative to the stock's own recent volatility, not just deep in absolute terms, because a five percent head on a quiet stock is a different signal than a five percent head on a stock that moves five percent on a normal day. It rewards reasonable symmetry between the left and right shoulder, a neckline that slopes the way a real reversal usually slopes, and a bullish RSI divergence between the head and the right shoulder, which is the classic momentum tell that selling pressure is fading even as the price reaches a new low. It also rewards freshness. A pattern whose right shoulder formed three days ago scores higher than the same pattern formed three weeks ago.
Volume (up to 12 points): Volume is what is happening underneath the price action. The score evaluates the absolute liquidity of the stock at the head, which acts as a basic tradeability filter and keeps thinly traded stocks from polluting the top of the rankings. It looks at how volume decays from the head into the right shoulder. A healthy reversal usually shows selling exhaustion as the right shoulder forms. And it looks at the speed of the recovery off the head combined with the volume that powered it. This measure captures the difference between a stock that limped back up over weeks and one that turned hard with conviction.
Breakout readiness (up to 13 points): Breakout readiness is the context around the pattern, the part that has nothing to do with the chart itself and everything to do with whether the stock is set up to breakout upwards beyond the resistance level. It looks at the RSI value at the right shoulder, because oversold readings at that point have historically preceded the strongest follow-through. We also assess the last-three-month stock performance relative to the broader market. The score rewards beaten-down stocks over the ones that are already running. Furthermore, the stock’s trend is assessed relative to the sector’s overall trend.
The three components are independent by design. A perfect setup needs to score well in all three categories.
The score distribution curve
Combining and aggregating the results the following table emerges:
| Quality Score | Obs | Win Rate | Market Beat Rate | Trade Return % |
|---|---|---|---|---|
| 20 - 24 | 24,901 | 51.0% | 44.9% | 0.10% |
| 25 - 29 | 18,940 | 53.9% | 45.9% | 0.28% |
| 30 | 2,804 | 55.0% | 45.8% | 0.41% |
| 31 | 2,390 | 56.0% | 45.4% | 0.28% |
| 32 | 1,937 | 56.0% | 46.3% | 0.50% |
| 33 | 1,613 | 56.5% | 44.9% | 0.50% |
| 34 | 1,322 | 58.9% | 47.3% | 0.48% |
| 35 | 1,188 | 61.9% | 50.5% | 0.81% |
| 36 | 801 | 66.7% | 56.2% | 1.13% |
| 37 | 546 | 73.1% | 63.7% | 1.90% |
| 38 | 201 | 76.6% | 67.7% | 2.03% |
| 39 | 32 | 93.8% | 81.3% | 3.35% |
The backtest period was from 1 Feb 2025 through 31 Dec 2025, which amounts to 230 trading days. In the backtest period we averaged about one 38+ detection per day (233 total) across the full NASDAQ and NYSE universe. During the backtest period not a single detection with a score of 40 was observed.
The curve is mostly monotonic for scores of 32 and above. This is the range of most detections we send out in our daily stock recommendations new letters. Detections below a pattern quality score of 30 are barely generating enough return to cover commissions. Between the scores of 30 to 34 performance starts improving noticeably, while the market beat rate remains below 50%. From a score of 35 onward performance grows more steeply and detections consistently outperform the market.
The small bucket of 39-score detections is not statistically significant. I included it here as the performance values show a meaningful progression of the performance curve. The larger bucket of score 38 is statistically significant.
The point of this table is to show that when combining the Inverse Head and Shoulders pattern with a scoring methodology a strong signal emerges. This methodological separation of good and bad trades results in detections that generate true financial value. That single shift, from "does the pattern work" to "which version of the pattern works best," is the practical lesson of the entire dataset. Every other finding in this article is an extension of it.
Should you enter on the breakout day or wait?
Once you have identified a high-quality setup, the next question is how to trade it. There are two findings in the data we made that can help the trader maximize the return. Both findings reward traders who are patient and observe the stock trend immediately after we send out our stock recommendation.
For context, StockDataAnalytics.com identifies their stock recommendations overnight and sends out the findings in the morning hours the following trading day before the stock market opens.
Price gap on recommendation day
The first finding centers around the relationship between the open price on the day of the recommendation and the prior close price. We split every trade into winners (MFE >= 3%) and losers (MFE \< 3%). The data shows that stocks that are opening down by at least 1.5% (Gap Range -2%) showing significantly higher win rates than stocks that are opening up. In fact, following that rule, we can improve a trader’s win rate on a specific score by about 13%. For instance, an Inverse Head and Shoulders detection with a pattern quality score of 30 has a baseline win rate of 55%. By only acting on detections that are gapping down by 1.5% or more the trader can improve their chances of winning to 68%. The table below shows that the findings are quite consistent for the score range between 20 and 34. The gap range is rounded to the nearest integer (eg. -5% equates to the gap range of -5.5% to -4.5%). We are showing the win rate broken out into three buckets: scores between 35 to 40 (35+), 30 to 34 and 20 - 29:
| Gap Range | Win Rate 35+ | Win Rate 30 - 34 | Win Rate 20 - 29 |
|---|---|---|---|
| \< -5.5% | 100% | 100% | 100% |
| -5% | 100% | 100% | 100% |
| -4% | 100% | 100% | 100% |
| -3% | 97% | 92% | 92% |
| -2% | 79% | 73% | 73% |
| -1% | 68% | 57% | 56% |
| 0% | 64% | 47% | 44% |
| 1% | 52% | 42% | 42% |
| 2% | 52% | 38% | 38% |
| 3% | 43% | 38% | 28% |
| 4% | 29% | 36% | 43% |
| 5% | 41% | 41% | 28% |
| > 5.5% | 64% | 31% | 21% |
Day 1 lows
The second signal is even more useful as it gives the trader a decision point at the close of the recommendation day. The charts below show the results:
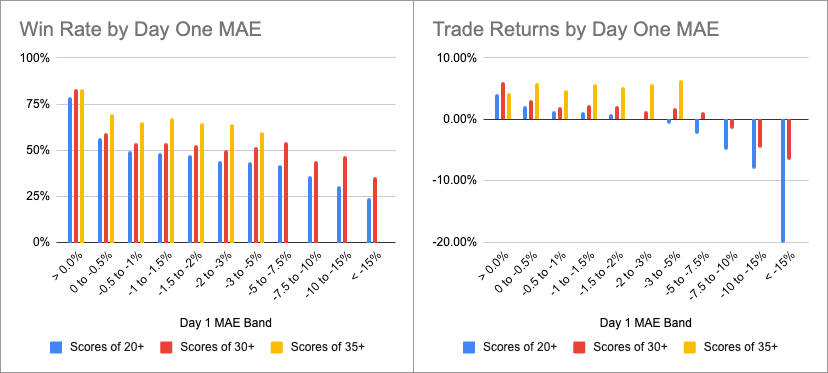
Detections whose intraday low never dropped below the day one open price returned over four percent on average and won nearly four times out of five. Trades that held within half a percent of entry won 56.8% of the time. From there, the win rate falls steadily and average return crosses zero once the day-one dip reaches three percent. The deepest day-one dips, those exceeding fifteen percent intraday, won only 24.1% of the time and lost twenty percent on average.
These findings are consistent across the lower scoring bands (20 - 34). For higher bands (35+), waiting for day-1 confirmation does not meaningfully improve results, and in some cases makes them worse. High-quality setups should be entered on the recommendation day without waiting.
The practical rule the data supports is simple: For scores of 34 and below, watch the first session before entering. If the stock's day one low is above 99.5% of the first day open, the trade is sitting in a population that meaningfully outperforms the baseline. If it has already dipped two or three percent intraday on day one, the population it now belongs to returns approximately zero. The decision can be made at the close of day one, not days later. And critically, this signal is not a proxy for pattern quality. The average composite score across all day-one MAE bands is essentially constant. The intraday-low filter compounds with the scoring system rather than substituting for it. For higher-quality setups (35 and up), enter on recommendation day.
Which market regimes does the pattern work best in?
A reversal pattern is a bet on the market changing its mind. That bet should pay off differently in different environments, and it does, but not in the direction most traders expect.
We tag every detection with a regime zone derived from the broader market state based on two dimensions:
- Does the market trend up (bull) or does it trend down (bear)?
- What is the confidence of that trend (low, medium or high)?
The resulting six regime zones provide us with an overall measure of market sentiment.
An interesting trend emerges when comparing the same quality of setup across the three bull regimes:
| Score | Regime | Obs | Win Rate | Trade Return |
|---|---|---|---|---|
| 37 | High Confidence Bull | 122 | 36.9% | -0.42% |
| 37 | Medium Confidence Bull | 242 | 80.2% | 1.89% |
| 37 | Low Confidence Bull | 159 | 78.6% | 3.52% |
| 35 | High Confidence Bull | 400 | 35.2% | -1.03% |
| 35 | Medium Confidence Bull | 529 | 67.3% | 1.36% |
| 35 | Low Confidence Bull | 213 | 89.7% | 2.82% |
| 30 | High Confidence Bull | 1,006 | 42.3% | -0.14% |
| 30 | Medium Confidence Bull | 1,488 | 55.3% | 0.62% |
| 30 | Low Confidence Bull | 183 | 73.2% | 1.43% |
The same quality of pattern, in three different bull environments, produces wildly different outcomes. Score-37 setups in low and moderate bull regimes win about 80% of the time. The same score in strong bull markets wins only 36.9% of the time. While the pattern generates significant returns in low and medium bull markets, it generates a loss in strong bull markets. The gap is too large to be sample noise and it shows up at every score band we have data for.
A working theory: the Inverse Head and Shoulders pattern is a reversal. In moderate bull markets there is room to reverse a trend. Stocks finish corrections, and turn back up, and the pattern catches them doing it. In a strong bull regime almost everything is already going up, so the "reversal" is more often a temporary shakeout in something already trending, or a setup that triggers right before the broader market adjusts. The pattern has nowhere to actually reverse to.
Bear regime samples are still thin in our current backtest, and I'm not going to extrapolate from underweighted data. The extended backtest will tell us whether the pattern produces a usable signal in down tape, or whether its real home is the moderate-bull middle where most reversals actually live. The high-confidence bull underperformance is large enough today that I would not personally take even a top-quality setup in a runaway bull market without thinking about it twice.
Pattern geometry conventional wisdom
Beyond the broader market regime, the shape of the pattern itself also matters. When researching the pattern, there are common points raised around pattern geometry. In this section we are reviewing five of those conventional wisdoms and share what we have learned from the data.
Pattern efficiency
Status: Textbook theory confirmed
Signal: Meaningful impact
The theory popularized by Warrior Trading was that tall and narrow patterns outperform short and wide ones. The reasoning was that a compressed pattern implies decisive reversal energy. We assessed this by dividing the head depth by the square root of the pattern duration in days. The data shows a clean monotonic effect. Low-efficiency patterns win around 42.7% of the time, while high-efficiency patterns win 65.1%. The average score varies slightly with low efficiency showing 29.9 while the high efficiency bucket shows 31.9. We are finding that the signal is the strongest in both medium confidence bull and medium confidence bear markets, while there is little impact to results in the strong bull market.
| Pattern Efficiency | Obs | PQS | Win Rate | Trade Return |
|---|---|---|---|---|
| (-0.001, 1.0] | 646 | 29.9 | 42.7% | 0.11% |
| (1.0, 1.5] | 2,151 | 30.7 | 47.1% | 0.41% |
| (1.5, 2.0] | 2,656 | 31.3 | 47.4% | 0.41% |
| (2.0, 3.0] | 3,680 | 31.8 | 54.5% | 0.53% |
| (3.0, 5.0] | 1,134 | 31.9 | 65.1% | 0.85% |
Volume decline from head to right shoulder
Status: Textbook theory rejected
Signal: Very weak
The theory, stated most clearly in Bulkowski's pattern encyclopedia, is that a healthy Inverse Head and Shoulders shows declining volume from the head into the right shoulder, because the right shoulder represents selling exhaustion and the buyers are stepping back in on reduced supply. The data is unconvincing. The steepest-decline bucket (volume down more than 60%) wins 54.3% of the time; the moderate-decline bucket (40 to 60%) wins 52.9%; the milder-decline bucket (20 to 40%) wins 48.0%; and the flat bucket (±20%) wins 50.9%. Average quality score is essentially flat across buckets (30.23 to 31.58). The spread from best to worst is only six win-rate points, it is not monotonic, and the flat bucket outperforms the mild-decline bucket, which is the exact opposite of what the theory predicts. The conclusion is that the volume-decline rule is either wrong, or it is drowning in noise at the resolution we can measure it.
| Volume Change | Obs | PQS | Win Rate | Trade Return |
|---|---|---|---|---|
| (-100%, -60%] | 1,428 | 31.4 | 54.3% | 0.50% |
| (-60%, -40%] | 5,075 | 31.6 | 52.9% | 0.53% |
| (-40%, -20%] | 2,968 | 31.2 | 48.0% | 0.44% |
| (-20%, 20%] | 795 | 30.2 | 54.3% | 0.34% |
Is a deep right shoulder a warning sign?
Status: Textbook theory rejected
Signal: Strong (inverted)
The theory, stated most sharply by TradingWithRayner, is that a deep or long right shoulder creates selling pressure on the way back up to the neckline and should be treated as a warning sign. Conventional advice is to prefer shallow right shoulders as "safer." The data rejects this cleanly and loudly. The shallow bucket (depth 1.6% to 5.8%) wins only 32.8% of the time with a trade return of -0.07%. The medium bucket (7.2% to 8.9%) wins 53.8% with a trade return of 0.6%. The deep bucket (11.1% to 25.8%) wins 66.5% with a trade return of 0.84%. That is a 34 win-rate-point spread and the trade return turns from slightly negative to 0.84%.
It is worth noting that the average quality score across the five buckets moves a little more than a full point (30.7 to 31.9), which means the performance spread cannot be explained by "deep right shoulders just happen to land in higher-quality patterns." The conclusion is that right shoulder depth is the single strongest independent geometric signal in our entire dataset, and the textbook rule is not just weak but backwards. Shallow right shoulders are where the losers live. Worth calling out: the effect holds across every bull regime and even in the moderate bear regime. Even in high confidence bull markets, where the pattern as a whole underperforms, the relationship continues to hold true.
| Shoulder Depth | Obs | PQS | Win Rate | Trade Return |
|---|---|---|---|---|
| (1.6%, 5.8%] | 2,071 | 30.7 | 32.8% | -0.07% |
| (5.8%, 7.2%] | 2,043 | 31.1 | 44.9% | 0.23% |
| (7.2%, 8.9%] | 2,065 | 31.3 | 53.8% | 0.60% |
| (8.9%, 11.1%] | 2,038 | 31.9 | 59.8% | 0.83% |
| (11.1%, 25.8%] | 2,050 | 31.6 | 66.5% | 0.84% |
Do inverse head and shoulders need symmetric shoulders?
Status: Textbook theory rejected
Signal: Moderate (inverted)
The theory, present in almost every technical analysis text, is that symmetric shoulders (left and right shoulder lows at roughly the same price) indicate higher pattern quality and better reliability. Across all regime zones, the symmetric bucket (under 3% price difference) wins 45.7%, the moderate bucket (3 to 6%) wins 49.3%, and the highly asymmetric bucket (over 10%) wins 58.5%. That looks like a clean rejection of the textbook. But the average quality score also climbs across these buckets, from 30.79 to 32.03, which accounts for roughly two to three points of the thirteen-point win-rate spread. The remaining ten points or so are the genuine geometric signal.
More importantly, the effect is regime-dependent in a way that undercuts a simple headline. In moderate and low confidence bull regimes, asymmetric shoulders clearly outperform symmetric ones. In high confidence bull markets, the relationship flips where symmetric patterns outperform asymmetric ones. In a moderate bear, the moderate bucket actually wins more than either of the extremes. From this we conclude that shoulder symmetry does not have an impact on the overall pattern performance but should be considered for moderate and low confidence bull markets.
| Abs Low Difference | Obs | PQS | Win Rate | Trade Return |
|---|---|---|---|---|
| (0%, 3%] | 2,934 | 30.8 | 45.7% | 0.30% |
| (3%, 6%] | 2,448 | 30.8 | 49.3% | 0.42% |
| (6%, 10%] | 2,830 | 31.6 | 54.5% | 0.61% |
| (10%, 15%] | 2,055 | 32.3 | 58.5% | 0.63% |
Bullish RSI divergence
Status: Textbook theory confirmed
Signal: Moderate
Bullish RSI divergence compares two moments in the pattern: the head and the right shoulder. In a classic Inverse Head and Shoulders scenario, the head is the lowest point in price and the right shoulder is a slightly higher low. The theory says to check what RSI values were observed in each of those points. If RSI at the right shoulder is higher than RSI was at the head, momentum is fading on the downside even as price is still reaching a new low. That is the divergence. The interpretation is that sellers are losing strength underneath the surface. By the time the right shoulder forms, the pressure that drove price to the head has already started to ease, which is supposed to make the reversal more likely to follow through.
The data shows a modest positive effect. The bullish divergence bucket wins 57.7% of the time with a trade return of 0.81%. The win rate hovers around 52.7% throughout a diversion of less than 10%. The strongly bearish divergence only wins 44.3% of the time with no noticeable trade return. Average quality score differs meaningfully across buckets, from 30.1 for bearish to 32.4 for bullish divergence, which explains roughly two points of the spread and leaves about ten points as genuine geometric signal. The conclusion is that bullish RSI divergence is a real but modest edge. It is also rare: only 2.3% of trades qualify as bullish divergence.
| RSI Divergence | Obs | PQS | Win Rate | Trade Return |
|---|---|---|---|---|
| (-100%, -5%] | 452 | 32.4 | 57.7% | 0.81% |
| (-5%, 5%] | 2,378 | 31.5 | 52.4% | 0.38% |
| (5%, 10%] | 2,725 | 31.6 | 53.1% | 0.67% |
| (10%, 20%] | 3,784 | 31.2 | 50.9% | 0.49% |
| (20%, 100%] | 928 | 30.1 | 44.3% | 0.01% |
Frequently asked questions about the Inverse Head and Shoulders pattern
What is an Inverse Head and Shoulders pattern?
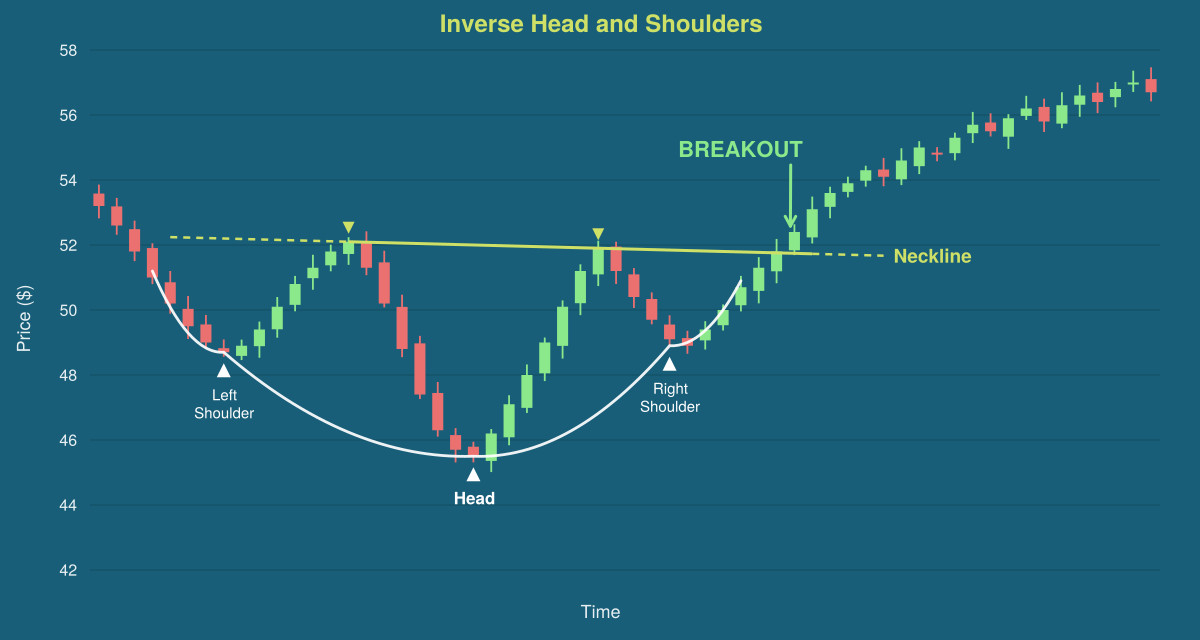
An Inverse Head and Shoulders is a bullish reversal pattern made of three troughs, a deeper middle low (the head) flanked by two shallower lows (the shoulders), capped by a resistance line called the neckline. The pattern completes when price breaks above the neckline.
What is the success rate of the Inverse Head and Shoulders pattern?
Across 67,041 detections we tracked from February through December 2025, the unfiltered pattern won only about 47 to 51% of the time, essentially a coin flip. Performance improves sharply with setup quality: detections scoring 37 of 40 on our composite scale won 73.1%, and 38-score detections won 76.6%. The widely cited 89% textbook success rate did not reproduce in our data.
Is a throwback to the neckline bullish or bearish?
Bearish, contrary to conventional advice. In our backtest, trades where price retested the neckline after the breakout won 43% of the time, while clean breakouts without a throwback won 85%. Waiting for a throwback as a "safer" entry put traders into the weaker half of the population.
Do the shoulders need to be symmetric?
No. Highly asymmetric patterns (shoulder lows more than 10% apart) won 58.5% of trades, while symmetric patterns (under 3% apart) won only 45.7%. The advantage holds in low and medium confidence bull markets but flips in strong bull regimes, so treat symmetry as a regime-dependent signal rather than a universal quality marker.
Should volume decline from the head into the right shoulder?
The data does not support this classic rule. The steepest volume-decline bucket won 54.3% of trades, but the flat-volume bucket also won 54.3%, and the buckets in between were not monotonic. The spread across all volume-decline groups was only six win-rate points, which is too weak and too noisy to trade on.
When is the best time to enter the trade?
It depends on setup quality. For detections scoring 34 or below, wait until the close of day one: if the intraday low stayed within 0.5% of the open, the trade belongs to a population winning 56.8% or better. Gap-downs of 1.5% or more also raise win rates by roughly 13 points. For setups scoring 35 and above, enter on the recommendation day without waiting.
Does the pattern work in strong bull markets?
No, and this surprises most traders. Score-37 setups won 80.2% in medium confidence bull markets and 78.6% in low confidence bull markets, but only 36.9% in high confidence bull regimes, where they produced a negative average return. As a reversal pattern, it needs corrections to reverse; in a runaway bull market almost everything is already rising.
What does this mean for you?
There are several key takeaways that you should consider when trading an Inverse Head and Shoulders pattern:
1. Segmentation is the baseline
When picking patterns start with the cleanest signal: pattern scoring. By filtering on pattern scores first you are starting off with a clean set of detections that you can filter down and refine further in the subsequent steps. If you are subscribing to StockDataAnalytics.com you will mostly receive detections of scores 32 and higher. Detections of 35 and above are considered strong.
2. Pay attention to the next day open gap
Flat or down opens are a feature - not a bug. Be careful of gap-ups, especially above two percent, as those skew the population towards losers. Wait for the boring entry, avoid the exciting ones.
3. Day one confirmation
Rather than jumping into a trade right after receiving the recommendation, consider waiting for a day and observing the day one trend. If the first-day low is flat to slightly down (less than 0.5% of open price) enter the trade at the end of day one.
4. Be regime aware
Moderate and low confidence bull markets is where this pattern does best. Avoid this pattern during high confidence bull markets as it will be difficult to generate meaningful results in that regime.
5. Favor deep right shoulders
The single strongest geometric signal in our dataset is right shoulder depth. Patterns with a deep right shoulder (more than 8.9% below the neckline peak) win 60+% of the time. Shallow right shoulders (under 5.7%) win only 32.8%. This is a more than 30-point spread from the same pattern, same score range, different geometry. The conventional advice that deep right shoulders are a warning sign is backwards.
6. The other geometric characteristics
Two other geometric features are worth observing. Tall and narrow patterns outperform short and wide ones, and bullish RSI divergence (RSI at the right shoulder higher than at the head) is a modest positive signal on the small subset of trades where it appears.
7. Setup as a probabilistic event
Treat any single setup as a probabilistic event. The winning trades and the losing trades come from the same population at any given quality level. The edge comes from sizing, consistent execution, and applying these filters across many trades, not from being right about a single detection.
These filters do not all have to be satisfied at once. The scoring filter is the foundation. The regime filter is the second most important. Day-1 confirmation, gap direction, and right shoulder depth each add incremental edge on top. A trade that checks all five is rare and very high conviction. A trade that checks three is still a meaningful edge over the unfiltered baseline.
Methodology and Limitations
These results come from a backtest of 67,041 completed Inverse Head and Shoulders detections across 6,000+ NYSE and NASDAQ stocks, covering the period from February 1 through December 31, 2025. Win rates are calculated using a recalibrated stop-and-target framework that we rebuilt earlier this year after fixing a backtesting bug that had inflated some of our older numbers. Market beat rates are calculated against same-period broader market performance. Trade returns are measured over a two-week period, following a simple trade strategy.
A few caveats worth naming directly: The very top of the scoring scale, at score 39, contains only 32 observations and should be read as directional rather than statistically definitive. Bear-regime samples are thin in the current backtest. Only the medium confidence bear zone had enough data to carry into most of the analysis, and the low and high confidence bear zones are excluded entirely. All performance figures here use MFE-based winner definitions (MFE ≥ 3%) rather than trade-return-based definitions, which keeps results stable across changes to stop/target configurations but means returns reported are maximum favorable excursion during the trade window, not realized returns at exit.
About StockDataAnalytics
StockDataAnalytics.com scans 6,000+ NYSE and NASDAQ stocks every trading day for sixteen bullish chart patterns, scores each detection on structure, volume, and breakout readiness, and delivers the top-ranked setups to subscribers before market open. If the analysis in this article was useful to you, the daily signals apply these filters and others across the full pattern set in real time.
About the author
Rene Haase is the founder of StockDataAnalytics.com. He previously held data engineering leadership roles at Amazon, Groupon, Paylocity, and Integral Ad Science, managing teams of up to 100 engineers, and holds economics degrees from German universities. He writes about systematic pattern analysis at stockdataanalytics.com/blog, seekingalpha.com/author/rene-haase and medium.com/@haase.rene.
Disclaimer: StockDataAnalytics.com is a financial data and analytics service. The information provided through our platform, including stock pattern detection, entry zones, stop losses, and price targets, is for informational and educational purposes only and does not constitute financial advice, investment advice, trading advice, or any other type of advice. We are not registered investment advisors, broker-dealers, or financial planners. Past performance of any pattern or recommendation does not guarantee future results. All investments involve risk, including the possible loss of principal. You should consult with a qualified financial advisor before making any investment decisions. By using our service, you acknowledge that all trading decisions are made at your own risk.