A widely-traded pattern built on two rules that do not survive the data
TL;DR: Across 39,037 trades, the symmetrical triangle wins 50.7% unfiltered, basically a coin flip. Quality-scored setups (35+) in low-confidence bull markets win 70.4%. Bulkowski’s 74% apex rule and the Edwards-Magee continuation rule both failed testing. Triangle height is the strongest geometric predictor.
The symmetrical triangle is one of the most universally taught chart patterns in technical analysis. Open any trading textbook, search for "symmetrical triangle pattern," or read Investopedia's entry and you will find the same two rules repeated everywhere. The first comes from Edwards and Magee, whose 1948 Technical Analysis of Stock Trends established that the symmetrical triangle is a continuation pattern roughly 75% of the time, so you should trade it in the direction of the prior trend. The second comes from Thomas Bulkowski, whose pattern statistics report that breakouts occur about 74% of the way from the base to the apex, with earlier breakouts dismissed as premature and later ones as unreliable.
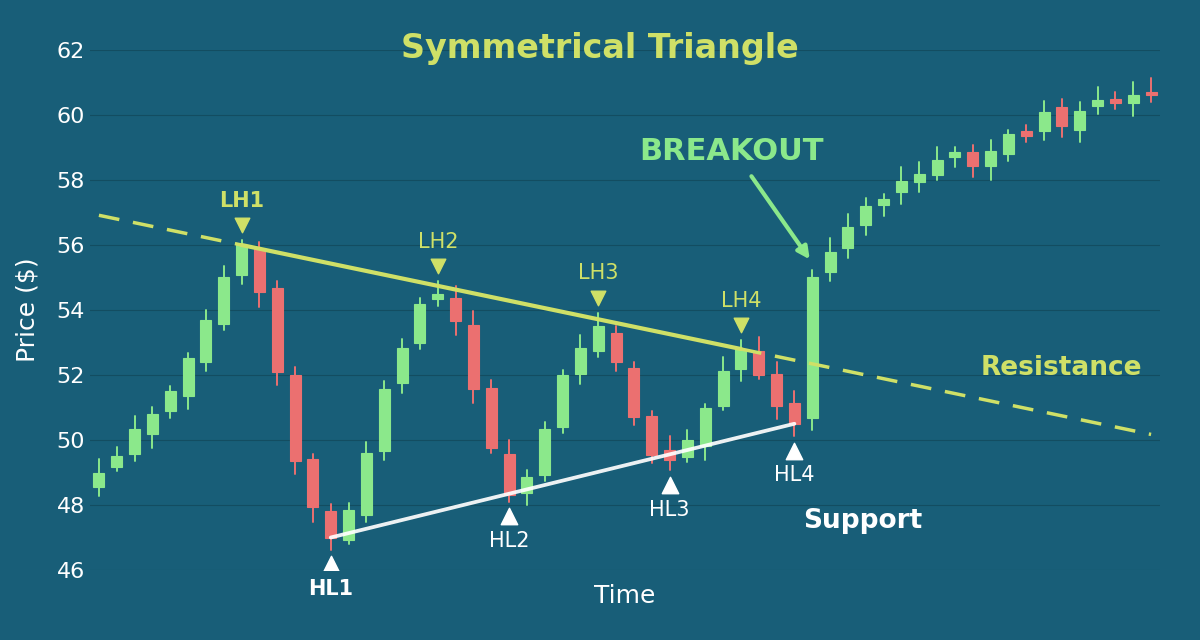
A symmetrical triangle pattern forms when price compresses between a downward-sloping resistance trendline and an upward-sloping support trendline, with both converging toward a future apex.
What you almost never find is real segmented performance data. How often does the symmetrical triangle breakout actually work? Which version of it works best? Do those two famous rules hold up when you test them on tens of thousands of trades?
Here are the key findings discussed in this article (39,037 trades analyzed):
- Unfiltered symmetrical triangle win rate: 50.7% (no economic edge)
- At quality score 35 in low-confidence bull markets: 70.4% win rate
- Bulkowski's 74% apex breakout rule: no predictive power (tested three ways)
- Edwards-Magee continuation framing: does not hold (reversal context performs equal or better)
- Strongest geometric predictor: triangle height
I run StockDataAnalytics, where we scan roughly 6,000 stocks every trading day across NYSE and NASDAQ for 16 bullish chart patterns including the symmetrical triangle. Every detection is scored across three independent dimensions and the resulting performance is logged trade by trade. The symmetrical triangle detector has now produced 39,037 scored trades across all market regimes. This article walks through what that data shows. Some of it confirms the textbook. The two rules the textbook is built on do not survive contact with the data.
How the symmetrical triangle performs unfiltered
Before any segmentation, the symmetrical triangle looks ordinary. At a quality score of 25, which sits near the middle of the range our detector reports, the Symmetrical Triangle win rate is 50.7%, the market beat rate is 46.8%, and the average trade return is 0.13%. Those numbers describe a coin flip with no economic edge. This is the version of the symmetrical triangle a trader experiences by taking every breakout that looks like a triangle, and it is broadly consistent with what published academic studies of chart patterns tend to find. Aggregated across every detection, the pattern is noise.
The textbook authors are implicitly aware of this, which is why they layer rules on top: wait for the breakout, confirm it with volume, trade the prior trend, watch where the breakout falls relative to the apex. The unfiltered pattern is not the trade. The filtered pattern is. The question worth answering is which filters actually carry information and how large the resulting edge is. That is the entire purpose of this analysis.
How does quality score affect symmetrical triangle win rate?
The edge starts to appear when we segment on quality score. Our scoring model rates each symmetrical triangle detection on three independent dimensions: Structure (the geometric quality of the converging trendlines and how cleanly price fills the triangle), Volume (accumulation versus distribution behavior as the pattern forms), and Breakout Readiness (proximity to and pressure against the trendline at the time of detection). The three components are designed to be independent so that a high total score reflects agreement across structure, volume, and timing rather than one strong dimension carrying a weak setup.
| Quality Score | Trades | Win Rate | Market Beat | Trade Return |
|---|---|---|---|---|
| 25 | 2,654 | 50.7% | 46.8% | 0.13% |
| 30 | 1,799 | 53.2% | 45.2% | 0.14% |
| 33 | 951 | 58.1% | 49.8% | 0.65% |
| 35 | 484 | 63.6% | 53.9% | 1.19% |
| 37 | 187 | 65.2% | 54.5% | 1.27% |
| 38 | 108 | 64.8% | 51.9% | 1.32% |
| 39 | 50 | 78.0% | 58.0% | 2.36% |
| 40 | 24 | 75.0% | 62.5% | 2.66% |
Win rate is defined as the percentage of trades that close higher than the open on the detection date. This definition is stable across changes to stop and target placement, which makes it useful for comparing setups against each other rather than against one particular exit rule.
Below a score of 30 the curve is essentially flat and the pattern offers no economic edge. Between 30 and 33 it begins to lift. The curve inflects around 34 and accelerates above 38. From score 35 to 39 the win rate climbs from 63.6% to 78.0% while the average two-week trade return roughly doubles. The two highest score bands are thin, with 50 trades at score 39 and 24 at score 40, so I treat the exact figures there as directional rather than definitive. The shape of the curve, however, is consistent and monotonic across the bands that carry real sample size. The single shift from "does the symmetrical triangle work" to "which scored version of it works" produces the entire economic edge of the pattern. Everything that follows refines that base lesson.
Day-one signals after the symmetrical triangle breakout
Once a symmetrical triangle breakout is published, the first trading day produces several signals that materially predict whether the trade will succeed. The most useful are the opening gap, the day-one intraday low, the closing strength within the day's range, and the day-two follow-through behavior. All of them are independent of pattern quality, meaning they add information beyond what the score has already captured.
The day-one intraday low, expressed as the worst drawdown from the entry on the first session, produces the cleanest monotonic curve in the entire dataset.
| Day-1 Intraday Low Band | Detections | Win Rate | Trade Return | Market Beat |
|---|---|---|---|---|
| 0 to -0.5% | 9,566 | 60.8% | 1.84% | 53.5% |
| -0.5 to -1% | 8,044 | 55.6% | 1.19% | 49.1% |
| -1 to -1.5% | 6,322 | 50.9% | 0.56% | 45.8% |
| -1.5 to -2% | 4,385 | 48.8% | 0.71% | 43.8% |
| -2 to -3% | 4,922 | 43.8% | -0.29% | 40.7% |
| -3 to -5% | 3,709 | 41.0% | -0.83% | 38.6% |
| \< -7.5% | 767 | 24.4% | -9.57% | 23.5% |
That is a 36-point win-rate spread driven by a single observation on the first day. A symmetrical triangle breakout that holds within half a percent of the entry on day one wins 60.8% of the time. One that gives back more than 7.5% intraday on day one wins 24.4% of the time. The first session is not noise. It is one of the highest-information filters available, and it costs nothing to observe.
The day-one closing strength tells a similar story. We measure where the stock closes within the day's range, from zero at the low to one at the high:
| Day’s Range | Detections | Quality Score | Win Rate | Market Beat Rate | Trade Returns |
|---|---|---|---|---|---|
| \< 20% | 8,396 | 26.0 | 39.0% | 36.1% | -1.79% |
| 20% - 40% | 7,498 | 26.2 | 45.3% | 40.7% | -0.77% |
| 40% - 60% | 7,116 | 26.2 | 50.8% | 45.9% | 0.49% |
| 60% - 80% | 7,512 | 26.2 | 57.2% | 50.3% | 1.66% |
| > 80% | 8,507 | 26.2 | 63.4% | 56.7% | 2.69% |
Breakouts that close in the weakest fifth of their range win 39.0% of the time. Breakouts that close in the strongest fifth win 63.4% of the time. That is a 24-point spread on a single close. Day-two follow-through compounds it further.
The headline 77.5% number is a trap if you treat it as an entry signal.
A symmetrical triangle breakout that produces a confirmed day one (an up close, a strong close, and elevated volume) followed by a day two that closes above the day-one high on sustained volume wins 77.5% of the time with a 76.1% market beat rate. While these look like impressive numbers, jumping on the bandwagon at the end of day two will cost you: the subsequent eight-day trade returns are negative. If you waited until day two, your best bet is to focus on the trade that had a stellar day one (an up close on day 1) but could not repeat that upward trend on day two. Those trades still generate an average 0.87% during the subsequent eight days.
The same setup without follow-through, or with a weak or rejected day one, wins 46.5% of the time. The first two sessions after the breakout carry as much information as the pattern score itself. Based on the numbers your best bet is to observe the first trading day and enter after the day-one signals have been recorded.
How does an opening gap affect a symmetrical triangle breakout?
The opening gap behaves more quietly than it does for some other patterns. A symmetrical triangle that opens with a gap down of 2% to 3% wins 54.0% of the time, while one that gaps up wins 45.6% of the time despite a much higher clean-trade rate.
| Gap Band | Detections | Win Rate | Mkt Beat Rate | Trade Return |
|---|---|---|---|---|
| \< -5% | 352 | 38.4% | 38.4% | -4.02% |
| -5% to -3% | 494 | 48.6% | 48.0% | 1.02% |
| -3% to -2% | 882 | 54.0% | 48.8% | 2.14% |
| -2% to -1% | 2,984 | 53.3% | 47.2% | 1.20% |
| -1% to -0.5% | 4,298 | 53.9% | 46.6% | 0.71% |
| -0.5% to 0% | 8,812 | 51.5% | 46.0% | 0.38% |
| >0% | 21,215 | 50.3% | 45.6% | 0.34% |
The mechanism is the familiar one: a large gap up means the breakout is already partly consumed by the time the trader can act, while a modest gap down often represents a still-intact, uncrowded entry. The effect is real but smaller than the day-one drawdown and close-strength signals, so I treat it as supporting evidence rather than a primary filter.
What happens when a symmetrical triangle throws back?
One number deserves its own mention because it contradicts a widely cited statistic. Of the symmetrical triangle trades that advanced at all, 70.2% experienced a throwback, a return to the breakout level after the initial move. That is meaningfully higher than Bulkowski's published rate of around 62%. What matters is what happens next, and the picture splits cleanly along two dimensions: whether the trade threw back at all, and what the quality score was going in.
| Throwback Path | Trades | Win Rate | Market Beat | Trade Return |
|---|---|---|---|---|
| Clean Breakout | 8,475 | 97.10% | 88.60% | 1.77% |
| Threw back, recovered | 12,996 | 73.80% | 73.80% | 1.90% |
| Threw back, failed | 7,458 | 20.20% | 19.20% | -0.15% |
| Never advanced | 11,099 | 8.30% | 10.20% | -3.03% |
The recovery rate from a throwback varies sharply by score:
| Score Band | Trades | Win Rate | Market Beat | Trade Return | % Recovered |
|---|---|---|---|---|---|
| 20 - 25 | 10,146 | 52.7% | 48.3% | 0.99% | 61.4% |
| 25 - 30 | 7,494 | 53.5% | 46.9% | 1.11% | 63.7% |
| 30 - 35 | 3,810 | 58.1% | 46.8% | 1.42% | 66.9% |
| 35 - 40 | 709 | 63.5% | 47.9% | 2.09% | 72.5% |
The practical reading is that a throwback on a symmetrical triangle is the normal path, not a warning sign, and exiting reflexively on the first pullback through the breakout level is the wrong default for this pattern. If the stock pulls back, it is still expected to generate a positive two-week return at every score band, though the magnitude of that return and the probability of recovery both rise sharply with the quality score going in.
What is the Symmetrical triangle performance by market regime?
We classify every trading day into one of six market regimes by combining direction (bull or bear) with confidence (low, medium, or high). The classification is based on broad market behavior at the time of detection, not on the individual stock. This is the same six-zone framework used in the earlier articles in this series. At a quality score of 33, the win rate spreads across regimes look like this:
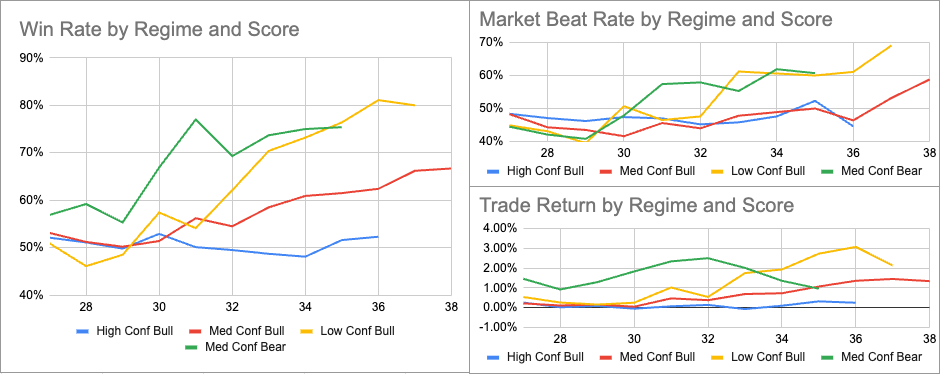
Two findings sit in that chart. The first repeats what the flat base analysis and the inverse head and shoulders analysis both showed. The strongest bull regime for this pattern is low-confidence bull, not high-confidence bull. At the same score of 33, a symmetrical triangle breakout in low-confidence bull markets wins 70.4% of the time while the identical score in high-confidence bull markets wins 48.7% of the time and produces a slightly negative trade return. That is a 21.7-point spread at the same pattern quality. The ordering holds at score 35, where low-confidence bull wins 76.4% against high-confidence bull at 51.6%. My interpretation is the one I keep arriving at across patterns: strong bull markets produce crowded trades. When everyone can see the breakout coming and is already positioned, there is no fresh demand left to fuel the move. In low-confidence markets there is still something to resolve as the trade is less crowded.
The second finding is specific to this pattern. It seems that the pattern does better around the transition between bull and bear market, with the medium-confidence bear market detections doing particularly well. I shared the low-confidence bear market data as well but the sample seems too small to draw any conclusions from. While I only showed a score of 33 as an example, a similar pattern is found in all other score bands.
Symmetrical triangle geometry rules tested
The symmetrical triangle has more geometry rules attached to it than almost any other pattern. We tested seven of them against the data, controlling for pattern quality so that a geometry effect cannot be an artifact of the score. The geometry analysis covers 33,282 trades after excluding the thinnest regime. Two textbook rules are confirmed, one is inverted, and the two foundational rules the pattern is built on are rejected. I am presenting the strongest findings first.
Does the 74% apex breakout rule work?
Status: Textbook rule rejected
Signal: None
This is the single most-cited rule for the symmetrical triangle. Bulkowski reports that breakouts occur about 74% of the way from the base to the apex, and the StockCharts reference teaches that the ideal breakout falls between half and three-quarters of the way through the pattern, with earlier breakouts premature and later ones unreliable. We measured this theory in three independent ways: progress to apex as a percentage of pattern length, an explicit early-middle-late timing zone, and a normalized apex-proximity ratio. All three are flat. Progress to apex moves the win rate from 49.5% in the earliest bucket to 52.2% in the latest, with expectancy drifting from 1.82 down to 1.53. The explicit timing zone moves from 48.7% early to 52.0% late. The apex-proximity ratio moves from 49.6% to 52.2%. Average pattern quality is nearly constant across every bucket of all three features, so the score is not hiding the effect. When three independently constructed features all show the same flat curve, there is no room left for "it depends on how you measure it." The most famous symmetrical triangle rule has no predictive power in our data, and the only directional drift it shows runs slightly against the textbook: later breakouts perform marginally better than early ones, not worse.
Is the symmetrical triangle really a continuation pattern?
Status: Textbook rule rejected
Signal: Weak, inverted in the strongest regimes
Edwards and Magee established the symmetrical triangle as a continuation pattern roughly 75% of the time and the entire conventional trade is built on that framing: find the prior trend, expect it to resume, trade the breakout in its direction. We flagged each detection by whether it formed in a continuation context or a reversal context and compared them directly.
| Context | Trades | Avg Score | Win Rate | Mkt Beat Rate | Trade Return |
|---|---|---|---|---|---|
| Reversal context | 17,330 | 26.9 | 51.2% | 46.3% | 0.19% |
| Continuation context | 15,952 | 25.1 | 50.9% | 46.7% | 0.10% |
Pooled across all regimes, continuation-context symmetrical triangles perform no better than reversal-context ones. They perform slightly worse on win rate, and trade returns. The textbook's central instruction does not carry information. In the two strongest regimes the relationship inverts outright. In low-confidence bull markets, reversal-context triangles win 58.5% with 0.8% trade return while continuation-context triangles win 49.0% with a 0.12% trade return. In medium-confidence bear markets, reversal context wins 64.5% with a 1.51% trade return against continuation context at 57.9% and 0.79%. Where the symmetrical triangle works best, it works best as a reversal, which is the opposite of how it is taught. My interpretation is that the symmetrical triangle is not really a continuation pattern at all. It is a volatility-compression pattern whose payoff is governed by height and regime, and the direction of the trend feeding into it is close to irrelevant.
Does the height of a symmetrical triangle predict performance?
Status: Textbook rule confirmed
Signal: Strong, on the size of the move
This is the strongest positive geometry finding and it confirms the textbook. Bulkowski's broader work identifies height as the single most reliable performance predictor across chart patterns: tall patterns outperform short ones. We measured height as the amplitude of the triangle as a percentage of price. Triangle height is the vertical distance between the upper and lower trendlines at the start of the pattern, divided by the price at the breakout.
| Triangle Height | Trades | Win Rate | Mkt Beat Rate | Trade Return |
|---|---|---|---|---|
| 0.6 to 9.0% | 6,657 | 49.4% | 45.2% | -0.06% |
| 9.0 to 12.7% | 6,656 | 49.6% | 45.3% | -0.03% |
| 12.7 to 17.1% | 6,656 | 49.9% | 43.6% | 0.02% |
| 17.1 to 24.3% | 6,656 | 52.1% | 47.8% | 0.29% |
| 24.3%+ | 6,657 | 54.3% | 50.0% | 0.53% |
The win-rate spread is a modest five points, but the size of the move tells the real story. Average trade returns significantly increase from the shortest quintile to the tallest. Tall symmetrical triangles do not just win slightly more often. When they win, they win much bigger. If you trade this pattern, the height of the triangle is the geometric feature that matters most.
Position relative to the 52-week range.
Status: Textbook rule rejected at the extreme
Signal: Weak, with the near-the-low bucket underperforming
Bulkowski's monthly-chart guidance is to buy the symmetrical triangle as close to the yearly low as possible. Across our daily-timeframe data the rule does not hold, and it fails at the exact point it makes its strongest claim. Symmetrical triangles forming within 15% of the 52-week low post the lowest win rate in the table (49.1%) and the second-lowest trade return (0.10%). The middle ranges, between 15% and 75% above the low, perform slightly better on both metrics. The most-extended quintile gives back trade return at the tail.
| Distance Above 52-Week Low | Trades | Avg Score | Win Rate | Mkt Beat Rate | Trade Return |
|---|---|---|---|---|---|
| 0 to 15% (near the low) | 7,384 | 27.2 | 49.1% | 44.3% | 0.10% |
| 15 to 25% | 6,366 | 27.1 | 52.2% | 45.7% | 0.30% |
| 25 to 50% | 9,705 | 26.1 | 50.5% | 45.9% | 0.13% |
| 50 to 75% | 4,416 | 25.0 | 53.7% | 49.9% | 0.21% |
| 75%+ (extended) | 5,332 | 24.0 | 51.2% | 48.6% | 0.05% |
There is a second detail in this table that matters as much as the rejected rule itself. The average pattern quality score falls monotonically across the buckets, from 27.2 in the near-the-low bucket down to 24.0 in the most-extended bucket. Our scoring model assigns its highest structure scores to setups sitting near the 52-week low, and those are precisely the setups that underperform. I treat this as a calibration weakness in the structure component, which I name openly in the limitations section. The practical reading for a trader is that a 52-week position is, at best, a weak filter, and the strongest version of the textbook claim is actually backwards.
Volume contraction through the pattern.
Status: Textbook rule confirmed, on the daily timeframe
Signal: Moderate
Every conventional source teaches that volume should contract as the symmetrical triangle forms. Our data confirms it for daily-timeframe detections. Triangles with strongly declining volume through the formation win 52.6% with a 0.26% average trade return. Triangles with rising volume win 50.3% with a 0.14% two-week trade return. The spread is small. It is worth noting that Bulkowski's monthly-chart data shows the opposite, with rising volume outperforming on the monthly scale. The rule survives here, but specifically on the daily timeframe our detector operates on, which is a useful reminder that pattern statistics do not always transfer across timeframes. Volume Trend measures the linear slope of daily volume across the pattern, expressed as a percentage change per session. Negative values mean volume is declining as the pattern forms.
| Volume Trend in Pattern | Trades | Avg Score | Win Rate | Mkt Beat Rate | Trade Return |
|---|---|---|---|---|---|
| \< -3% | 6,657 | 26.3 | 52.6% | 46.9% | 0.26% |
| -3% to -1.5% | 6,656 | 26.2 | 50.7% | 45.6% | 0.14% |
| -1.5% to -0.3% | 6,656 | 26.0 | 51.3% | 46.3% | 0.07% |
| -0.3% to 0.1% | 6,656 | 26.0 | 50.5% | 46.2% | 0.14% |
| >0.1% | 6,657 | 25.7 | 50.3% | 47.4% | 0.14% |
Do the two trendlines need to converge at equal slopes?
Status: Textbook rules rejected
Signal: None
Two identification rules round out the geometry. Every guide insists the two trendlines must converge at roughly equal absolute slope or the pattern is something else. The win rate ranges between 49.7% and 51.5%, which is not a meaningful variation. The slope ratio measures the upper trendline's slope magnitude as a percentage of the lower trendline's. A value of 100% means the two trendlines slope at exactly equal absolute rate, the textbook-ideal symmetric case.
| Slope Ratio | Trades | Avg Score | Win Rate | Mkt Beat Rate | Trade Return |
|---|---|---|---|---|---|
| \< 50% | 6,657 | 25.7 | 51.4% | 46.6% | 0.12% |
| 50% to 80% | 6,656 | 26.0 | 51.5% | 46.2% | 0.16% |
| 80% - 125% | 6,656 | 26.0 | 51.4% | 45.5% | 0.16% |
| 125% - 200% | 6,656 | 26.2 | 51.4% | 47.9% | 0.20% |
| >200% | 6,657 | 26.2 | 49.7% | 46.3% | 0.12% |
Do more trendline touches make a symmetrical triangle more reliable?
Status: Textbook rules rejected
Signal: None
Textbook conventional wisdom states that more trendline touches make a stronger pattern, with six touches treated as ideal. The data does not support this statement. Triangles with the minimum four touches win 51.7% while those with seven or more touches win 50.8%. This difference in the results can more be explained as noise than a meaningful trend.
| Trendline Touches | Trades | Avg Score | Win Rate | Mkt Beat Rate | Trade Return |
|---|---|---|---|---|---|
| 4 or less | 11,216 | 26.0 | 51.7% | 47.7% | 0.26% |
| 5 | 9,818 | 25.9 | 50.6% | 46.0% | 0.09% |
| 6 | 6,033 | 26.3 | 51.0% | 45.9% | 0.17% |
| 7 or more | 6,215 | 26.2 | 50.8% | 45.6% | 0.02% |
Frequently Asked Questions About the Symmetrical Triangle Pattern
What is a symmetrical triangle pattern?
A symmetrical triangle pattern forms when a stock's price compresses between a downward-sloping resistance line connecting lower highs and an upward-sloping support line connecting higher lows, with both lines converging toward a future apex. It is one of sixteen bullish chart patterns scanned daily by StockDataAnalytics across NYSE and NASDAQ.
Is the symmetrical triangle pattern reliable?
Unfiltered, no. Across 39,037 detections, the average win rate at a mid-range quality score is 50.7%, which is a coin flip with no economic edge. The pattern only becomes profitable once you segment by score and market regime. At a quality score of 35 in low-confidence bull conditions, the win rate climbs to 76.4%.
What is the win rate of the symmetrical triangle pattern?
It depends entirely on the quality score and market regime. At the unfiltered baseline, 50.7%. At a score of 35 it rises to 63.6%. At a score of 38 or higher it reaches 64.8% to 78.0%. In the strongest regime, low-confidence bull at score 33 or higher, win rates of 70.4% to 76.4% are common.
Does Bulkowski's 74% apex breakout rule work?
No. Tested three independent ways across 33,282 trades, breakout location within the pattern has no predictive power. Win rate varies by less than three percentage points between breakouts that occur halfway through the pattern and breakouts that occur right at the apex. The slight trend, where it exists, runs opposite to the textbook: late breakouts perform marginally better than early ones.
Is the symmetrical triangle a continuation or a reversal pattern?
Edwards and Magee taught that it is a continuation pattern roughly 75% of the time. Our data does not support that framing. Pooled across all regimes, continuation-context and reversal-context setups perform within 0.3 percentage points of each other on win rate. In the strongest regimes, reversal-context setups outperform continuation-context ones, sometimes by more than nine win-rate points.
What triangle height performs best?
The tallest quintile, where triangle height is 24.3% of price or more, wins 54.3% of the time with average trade returns of 0.53%. The shortest quintile, with height under 9%, wins 49.4% with a slightly negative return. Tall triangles do not just win more often, they win bigger. Height is the single strongest geometric predictor.
Should I trade symmetrical triangles in a strong bull market?
No, that is the worst environment for this pattern. At a quality score of 33, the win rate in high-confidence bull conditions is 48.7%, with a slightly negative trade return. The identical score in low-confidence bull conditions wins 70.4%. Strong bull markets produces crowded trades where the breakout is already priced in.
What does a throwback mean and is it a bad sign?
A throwback is a return to the breakout level after the initial post-breakout move. They are normal, not a warning. Roughly seven of ten symmetrical triangle trades that advance throw back, and 63.7% of those throwbacks recover and finish as winners. The recovery rate is higher for higher-quality setups: 74.5% for setups at score 35 or above, versus 37.7% for scores 20 to 25.
How important is volume contraction in a symmetrical triangle?
Modestly important on the daily timeframe. Triangles with strongly declining volume through the formation win 52.6% with trade returns of 0.26%. Triangles with rising volume win 50.3% with trade returns of 0.14%. The textbook rule survives but with a small effect. Worth noting: Bulkowski's monthly-chart data shows the opposite, so this finding does not transfer across timeframes.
Do the two trendlines need to slope at equal angles?
No. Across 33,282 trades, triangles where the upper and lower trendlines have very different slope magnitudes perform indistinguishably from textbook-perfect symmetric triangles. Win rates across the full range of slope asymmetry vary by less than two percentage points. The aesthetic distinction between a balanced symmetrical triangle and a lopsided one is a label, not a performance differentiator.
What is the best entry signal after a symmetrical triangle breakout?
The day-one intraday low produces the cleanest filter. Breakouts that hold within half a percent of the entry on the first session win 60.8% of the time. Those that give back more than 7.5% intraday win 24.4% of the time. A confirmed day one followed by a day-two close above the day-one high on sustained volume wins better than three times in four. Watch the first two sessions before sizing in.
How to trade the symmetrical triangle pattern
Distilling 39,000 symmetrical triangle trades into rules you can act on:
1. Score is the foundation. The unfiltered symmetrical triangle is a coin flip with no edge. The scored version is not. A score of 33 to 35 is the practical floor where the edge becomes real, and 38 and above is the high-conviction tier. Below 30 the pattern offers no economic edge and should not be traded as a standalone breakout.
2. Well-known pattern. The symmetrical triangle is a well-known pattern and finding an edge in that pattern is difficult to do. Besides the regime finding, most analyses have revealed only a marginal edge. If you are new to trading, I would recommend a less well-known pattern. Both the flat base pattern and the inverse head and shoulders pattern have provided more significant findings.
3. The regime matters more than the trend feeding into the triangle. A symmetrical triangle in low-confidence bull markets outperforms the identical setup in high-confidence bull markets by more than twenty win-rate points at the same score. Strong bull markets is the worst environment for this pattern, not the best. Medium-confidence bear is one of the strongest. If the broad market is in a confident uptrend, this is not the time to weigh symmetrical triangle breakouts heavily.
4. Ignore where the breakout falls relative to the apex. The 74% rule is the most-cited symmetrical triangle statistic and it has no predictive power in our data, confirmed in three independent ways. Do not pass on a breakout because it came early, and do not place extra confidence in one because it came near the apex.
5. Stop treating it as a continuation pattern. The breakout direction relative to the prior trend does not predict outcomes, and in the strongest regimes the reversal-context setups outperform the continuation-context ones. Trade the breakout the market gives you, not the breakout the prior trend predicts.
6. Favor tall triangles. Height is the geometric feature that carries the most information. The tallest quintile of triangles delivers roughly triple the favorable excursion of the shortest. A tall symmetrical triangle is worth more than a textbook-clean short one.
7. Watch the first two sessions. If you cannot enter on day one, the best fallback is a stock that had a strong day one but failed to follow through on day two. Those still average 0.87% over the next eight days. Entering at the end of a confirmed day two, despite the 77.5% headline win rate, produces negative average returns afterward because the move is already consumed.
8. Do not panic on the throwback. Seven of ten advancing trades throw back through the breakout level, and roughly two-thirds of those recover and finish as winners. A throwback is the normal path for this pattern. Reflexively exiting on the first pullback is, on average, the wrong decision.
9. Treat any single setup as a probabilistic event. Even at the highest combined conviction, score 38 or above, low-confidence bull markets, tall triangle, confirmed day one and day two, the probability of failure is never zero. Position sizing and stop placement do most of the work in any system. No filter described here changes that.
Methodology and limitations
The symmetrical triangle detector produced 39,037 scored trades. The geometry analysis covers 33,282 trades after excluding the high-confidence bear regime, which had only 67 detections and is too thin to interpret. Win rate is determined based on the close two weeks after the detection: a trade is a winner if its price closes above the open price on the recommendation date. Market beat rate measures how often the trade's return over the same window exceeded the market's return over that window. Trade return calculates the returns based on a single trading strategy where we enter on recommendation date at the open price and exit when (1) the price closes above the target, (2) the price closes below the stop loss or (3) ten trading days have passed.
Several limitations deserve direct statement, because naming them is part of how this work is done. The two highest score bands, 39 and 40, carry only 50 and 24 trades respectively, so the exact figures there are directional rather than definitive even though the curve they sit on is monotonic. The low-confidence bear regime carries 27 trades at the score level discussed and should be read as a flag, not a conclusion. Most importantly, the 52-week-position analysis surfaced a real weakness in the current scoring model: the structure component is assigning its highest scores to setups near the 52-week low that go on to underperform. That is a calibration issue I am treating as a model-improvement task separate from this article, and stating it openly here is more useful to a reader than hiding it would be.
About StockDataAnalytics
StockDataAnalytics scans roughly 6,000 stocks every trading day across NYSE and NASDAQ for 16 bullish chart patterns, scores each detection across structure, volume, and breakout readiness, and delivers the highest-conviction setups to subscribers before the market opens. If the analysis in this article was useful to you, the daily signals apply these filters and many others across the full pattern set in real time.
About the author
Rene Haase is the founder of StockDataAnalytics. He spent a 30-year career in data and engineering leadership, building and running software and data teams at Amazon, Groupon, Integral Ad Science, and Paylocity, and holds economics degrees from German universities. He writes about systematic chart pattern analysis with a focus on what the data confirms and what it contradicts. More of this work is on the SDA blog.
What comes next
This is the third article in a planned series covering all 16 bullish patterns in our detector. The first, on the inverse head and shoulders, and the second, on the flat base, are both on the SDA blog. If your own data on the symmetrical triangle breakout disagrees with anything here, I would genuinely like to hear it. The most useful corrections I get come from traders who track their own results.
Disclaimer: StockDataAnalytics.com is a financial data and analytics service. The information provided through our platform, including stock pattern detection, entry zones, stop losses, and price targets, is for informational and educational purposes only and does not constitute financial advice, investment advice, trading advice, or any other type of advice. We are not registered investment advisors, broker-dealers, or financial planners. Past performance of any pattern or recommendation does not guarantee future results. All investments involve risk, including the possible loss of principal. You should consult with a qualified financial advisor before making any investment decisions. By using our service, you acknowledge that all trading decisions are made at your own risk.