A widely-taught Pattern that almost nobody segments
The flat base pattern works best in low-confidence bull markets and stops working in strong bull tape, which directly contradicts the most famous rule in the most famous trading book. At quality score 38, win rate is 89% in low-confidence bull regimes, 71% in medium-confidence bull, and 62% in high-confidence bull. CANSLIM's M, the rule that says trade breakouts in confirmed uptrends and avoid them in weak tape, is inverted for this pattern. This is one of several findings from a 34,312-trade dataset that contradict what is taught about the flat base.
I run StockDataAnalytics, where we scan roughly 6,000 stocks every trading day across NYSE and NASDAQ for 16 bullish chart patterns including Flat Base. Each detection is scored across three dimensions and the resulting performance is logged trade by trade. The Flat Base detector has now produced 34,312 scored trades across all market regimes. This article walks through what that data shows. Some of it confirms the textbook. A surprising amount of it rejects the textbook. The single largest finding directly contradicts the most famous rule in the most famous trading book.
The Unfiltered Flat Base: Why It Looks Like a Coin Flip
Before any segmentation, the flat base looks ordinary. At a pattern quality score (PQS) of 25, which is an average quality detection, the win rate is 48.2%, the market beat rate (the percentage of trades whose return exceeded their market’s return over the same holding window) is 46.3%, and the average trade return is 0.10%. Those numbers describe a pattern that is essentially a coin flip with no economic edge. This is the version of the flat base that a trader would experience by trading every detection blindly, and it is reasonably consistent with what most published academic studies of chart patterns report. Patterns aggregate to noise and the conclusion is that they don’t work.
The textbook authors are aware of this, which is why O'Neil and his successors layer rules on top: depth limits, duration windows, volume thresholds, market direction filters. The unfiltered pattern is not the trade. The filtered pattern is. The question we are interested in is which filters actually work and how big the resulting edge is.
The edge starts to appear when we segment on quality score. Our scoring model rates each detection on three independent dimensions: Structure (geometry quality), Volume (accumulation versus distribution behavior in the base), and Breakout Readiness (proximity to and pressure against the upper boundary). The three components are independent by design.
| Quality Score | Trades | Win Rate | Market Beat | Trade Return |
|---|---|---|---|---|
| 25-29 | 19,871 | 48.9% | 46.0% | 0.10% |
| 30-34 | 10,016 | 51.3% | 47.7% | 0.31% |
| 35 | 1,312 | 57.1% | 52.7% | 0.69% |
| 36 | 1,067 | 60.1% | 54.7% | 0.73% |
| 37 | 811 | 61.4% | 55.1% | 0.76% |
| 38 | 557 | 65.2% | 56.2% | 0.98% |
| 39 | 367 | 69.5% | 57.2% | 1.19% |
| 40 | 311 | 76.5% | 54.7% | 1.64% |
Win rate is calculated as the percentage of trades the close higher two weeks after recommendation. This definition is stable across changes to stop and target placement, which makes it useful for comparing setups.
Below score 30 the curve is flat. Between 30 and 34 it begins to climb. Above 35 the curve inflects, and from 35 to 39 the win rate climbs nearly thirteen points while the trade return more than doubles. The win rate at score 40 is 76.5%, an improvement of 28 points over the unfiltered baseline. The single shift from "does the Flat Base chart pattern work" to "which version of the Flat Base chart pattern works" produces the entire economic edge of the pattern. That is the practical lesson of the dataset, before we examine any other filter.
Day-One Signals That Predict Flat Base Outcomes
Once a recommendation is published, the first trading day produces several signals that materially predict whether the trade will succeed. The most useful of these are the open-day gap, the day-one intraday low, the closing position within the day's range, and the day-two confirmation behavior. All four are independent of pattern quality, meaning they add information beyond what the score has already captured.
The Open-Day Gap
The curve is shaped like a barbell. Scenarios where the stock gaps more than 5% down or more than 2% up the trade is collapsing. The strongest returns can be seen when the stock gaps down between 1% and 3%, which is also the range where the win rate is the highest. The market beat is bimodal: the trade beats the market when there's a meaningful gap in either direction (-3% to -2% or +1% to +2%), and underperforms the market when the open is near flat.
| Gap Band | Obs | Win Rate | Market Beat Rate | Trade Return |
|---|---|---|---|---|
| < -5% | 95 | 42.1% | 38.9% | -1.06% |
| -5% to -3% | 142 | 65.5% | 52.1% | 1.83% |
| -3% to -2% | 386 | 68.1% | 53.6% | 3.01% |
| -2% to -1% | 1,905 | 66.1% | 49.3% | 2.71% |
| -1% to -0.5% | 2,776 | 61.6% | 47.5% | 1.77% |
| -0.5% to 0% | 5,565 | 59.5% | 46.6% | 1.20% |
| 0% to +0.5% | 7,448 | 59.0% | 46.7% | 1.16% |
| +0.5% to +1% | 3,611 | 62.8% | 49.7% | 1.60% |
| +1% to +2% | 1,887 | 64.3% | 52.9% | 1.78% |
| +2% to +3% | 366 | 53.8% | 47.3% | 1.11% |
| +3% to +5% | 296 | 36.5% | 36.8% | -0.67% |
| > +5% | 161 | 36.6% | 33.5% | -0.58% |
Day-One Closing Strength
This is the strongest single day-one signal in the dataset. We measure where the stock closes within its day-one range, on a 0-to-1 scale where 0 is closing at the day's low and 1 is closing at the day's high. The framework is sometimes called close-in-range and is associated with Brian Shannon in the technical trading community.
| Day-1 close in range | Trades | Win Rate | Market Beat |
|---|---|---|---|
| Below 0.2 (closed near low) | 4,971 | 48.7% | 36.5% |
| 0.2 to 0.4 | 4,454 | 57.4% | 44.4% |
| 0.4 to 0.6 | 4,508 | 60.4% | 47.4% |
| 0.6 to 0.8 | 5,038 | 65.0% | 51.3% |
| 0.8 and above (closed near high) | 5,666 | 69.6% | 57.3% |
The win rate spread is 21 points across this single dimension, and the market beat spread is also 21 points. The average quality score is essentially constant across all five buckets (31.5 to 31.8), which means closing strength adds information beyond what the pattern score already captures. A flat base detection that closes weak on day one is a different setup than the one we recommended.
Day-Two Follow-Through
The day-two follow-through signal looks at first like a powerful entry filter. When a Flat Base recommendation closes up with closing strength of 0.7 or higher and relative volume of 1.4 or higher on day one (CONFIRMED), then closes above the day-one high on at least 90% of day-one volume on day two (FT), the full-trade win rate is 82.1% and the average return is 6.13% across 262 observations. Trades that fail both tests win only 54.1% of the time and return 0.55%. The follow-through condition does not appear in any of the textbook frameworks we reviewed. It is purely empirical, and it is the single largest combined-signal effect in the dataset.
The more interesting finding is what happens after the signal appears. By the time both day-one confirmation and day-two follow-through are visible, the trader is standing at day-two close, and most of the return has already been captured. Trades in this group produce only 0.27% over days three through ten. The dataset average for that same window is 0.97%. Confirmed trades that have not yet followed through return 1.02% over the remaining hold, the highest of any group in the table. The follow-through signal is not telling you to enter. It is telling you the pattern has done its job.
The WEAK_or_REJECTED group also shows 1.02% of remaining return, but this is largely mean reversion: those trades have already drawn down sharply by day two close (average maximum adverse excursion or MAE of negative 4.81%), and the remaining return reflects bounce-back from losses the trader has either absorbed or been stopped out of. It is not the pattern working.
| Group | Obs | Win Rate | Market Beat Rate | Trade Return | Remaining Trade Return |
|---|---|---|---|---|---|
| CONFIRMED + FT | 262 | 82.1% | 74.4% | 6.13% | 0.27% |
| CONFIRMED + No_FT | 1,518 | 71.6% | 60.4% | 3.20% | 1.02% |
| PARTIAL + FT | 2,983 | 76.8% | 66.2% | 3.93% | 0.77% |
| PARTIAL + No_FT | 8,119 | 62.2% | 50.8% | 1.54% | 0.87% |
| WEAK_or_REJECTED | 27,782 | 54.1% | 42.6% | 0.55% | 1.02% |
| TOTAL | 40,664 | 58.2% | 46.9% | 1.13% | 0.97% |
The takeaway from these day-one and day-two signals is that the Flat Base is not a single decision. The pattern at detection gets the subscriber into the trade. What happens over the next two sessions determines what they actually keep. Day one tells the trader whether the pattern is working: a confirmed close means the trade has room to run, a weak close means the pattern is already breaking. Day two tells the trader when the work is done: follow-through means the move has happened and what remains is small. Neither signal is an entry filter. Both are post-entry signals that convert a static recommendation into a managed position, and the difference between using them and ignoring them shows up not in win rate but in how much of each winner the trader keeps.
Flat Base Performance by Market Regime: The CANSLIM Inversion
This is the section where the data most directly contradicts O'Neil. CANSLIM has seven letters and the M stands for Market Direction. The rule is well-known: trade Flat Base setups when the broader market is in a confirmed uptrend, avoid them when the market is in a downtrend or correction. The intuition is that strong tape lifts breakouts while weak tape kills them. The data says something different.
We classify each trading day into one of six market regimes by combining direction (bull or bear) with confidence (low, medium, or high). The classification is based on broad market behavior at the time of detection which scores the market regime with an outcome between negative one (high confidence bear market) and positive one (high confidence bull market). The pattern quality score is built from three components: structure, volume, and breakout readiness. A higher score means a cleaner setup. The textbook prediction is that this should hold everywhere. Better setups should produce better outcomes regardless of what the broader market is doing. The data says otherwise.
When I split the 33,000 flat base detections by regime zone and plot win rate against PQS, three different stories appear.
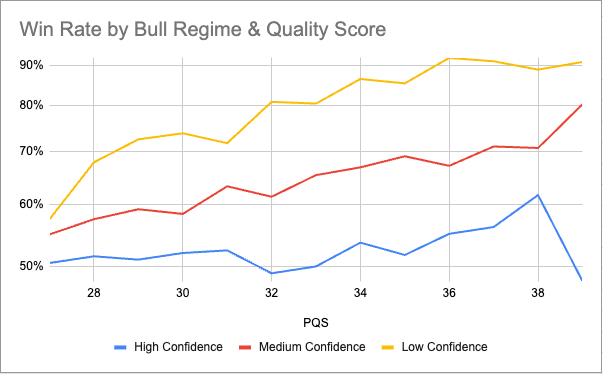
In low-confidence bull tape, the pattern works as designed. Win rate climbs from 57% at PQS 27 to 92% at PQS 36, and the slope is monotonic. Higher quality, better outcomes. In medium-confidence bull tape, the slope is gentler but still present: roughly 55% at PQS 27 climbing to the low 70s at PQS 38. The system is doing real work in both regimes.
In high-confidence bull tape, the line goes flat. From PQS 27 through PQS 38, climbs from 51% to 62%. The highest-quality patterns in this regime do not outperform the lowest-quality patterns. At PQS 38, high-confidence bull win rate is actually 27% lower than that of the low-confidence bull win rate. The score for the high confidence bull market is quite weak.
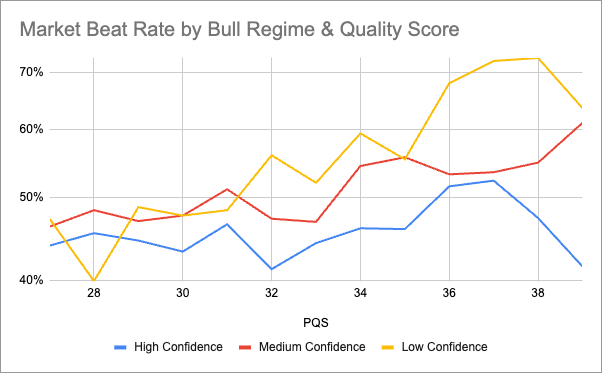
The market beat rate chart shows a similar picture. In low-confidence bull tape, the line crosses above 50% around PQS 32 and climbs into the upper 60s and low 70s at the top of the score range. Higher-quality patterns reliably beat a buy-and-hold baseline. In medium-confidence bull tape, top scores reach a market beat rate in the low 60s.
In high-confidence bull tape, the line never reliably crosses 50%. Across every score band, market beat rate sits between 41% and 52%. The pattern is not adding anything over what the regime is already producing. A subscriber holding the underlying index would have done at least as well, and often better, than a subscriber filtering for the highest-quality flat base setups in this regime.
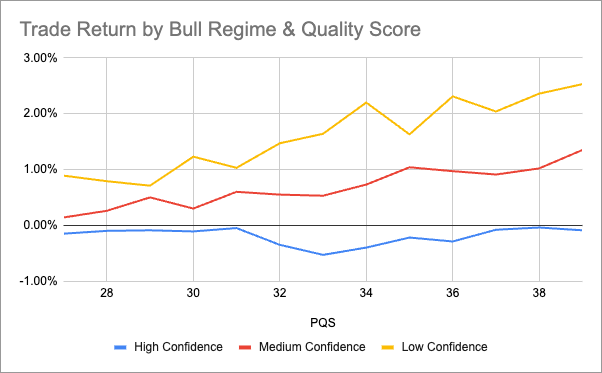
The return chart converts the same finding into dollars. The low-confidence bull line ranges from 0.89% at PQS 27 to 2.53% at PQS 39. The high-confidence bull line is producing consistently negative returns. At PQS 33 in high-confidence bull, the average trade returns negative 0.53% on 644 observations.
The explanation is that pattern quality cues get drowned out in strong bull tape. When everything is rising and breaking out, the volume spike, the structural tightness, and the breakout readiness signals that PQS measures stop being distinctive. Every chart looks like it is breaking out because the regime is doing the work. The result is that high-PQS detections in high-confidence bull markets include a much higher proportion of false positives. Patterns that look textbook but are really just stocks riding the tide. The scoring system cannot distinguish them from genuine accumulation, so the score collapses as a predictor.
The practical implication is straightforward. PQS is not a regime-independent quality metric. It works in low-confidence and medium-confidence bull tape, and it stops working in high-confidence bull tape. A subscriber acting on a high-PQS flat base in a strong bull regime is not getting the edge the score implies. The honest reading of the data is that in high-confidence bull, the regime gate matters more than the score, and the score should be weighted down or ignored. This is not what the textbook frameworks say, and it is not what an SDA subscriber would expect from a quality-scored recommendation. It is what the data shows.
Flat Base Geometry Rules: What Holds and What Breaks
Five geometry rules are commonly taught for flat bases. We tested all five against the data. One is confirmed, one is partially rejected, two are rejected outright, and one is regime-dependent.
How long should a flat base last?
Status: textbook rejected. Bulkowski reports that rectangle bottoms (a close cousin of the flat base) longer than the 65-day median produce a 51% post-breakout rise versus 41% for shorter formations. The "bigger the base, the higher in space" maxim is a near-universal teaching. Our data rejects it for the flat base. Win rate by base duration traces a clear hill shape with a peak of about 30 to 40 days, which produces a win rate of 65.4%. The cliff replicates across all three bull regimes. Beyond 55 days the pattern is something else: stale supply, lost momentum, or both.
| Base Range | Obs | Avg. QS | Win Rate | Mkt Beat Rate | Trade Return |
|---|---|---|---|---|---|
| < 20 days | 5,463 | 30.6 | 56.6% | 48.3% | 0.17% |
| 20 - 30 days | 8,611 | 30.2 | 56.8% | 47.4% | 0.16% |
| 30 - 40 days | 7,077 | 29.9 | 65.4% | 53.5% | 0.59% |
| 40 - 55 days | 7,025 | 29.0 | 56.4% | 46.4% | 0.33% |
| > 55 days | 6,136 | 27.6 | 53.0% | 42.2% | 0.09% |
Should a flat base be perfectly flat?
Status: textbook rejected. The flat base, by definition, is supposed to be flat. Our data shows that a base with a slight upward slope outperforms a base that is perfectly flat. The win rate peaks in the slope bucket where the base drifts modestly upward across its duration, and drops back to baseline when the slope is either zero or steeply positive. The interpretation is that quiet upward drift signals institutional accumulation; a perfectly flat base signals indecision with no underlying bid. The "flat" in flat base is not the optimal shape; the optimal shape is gently rising.
| Base Slope | Obs | Avg. QS | Win Rate | Mkt Beat Rate | Trade Return |
|---|---|---|---|---|---|
| < 0.13 | 6,866 | 28.9 | 56.7% | 42.6% | 0.37% |
| 0.13 - 0.25 | 6,891 | 28.8 | 55.6% | 45.9% | 0.23% |
| 0.25 - 0.35 | 6,867 | 29.4 | 59.3% | 50.1% | 0.39% |
| 0.35 - 0.48 | 6,844 | 30.0 | 61.7% | 51.5% | 0.38% |
| > 0.48 | 6,844 | 30.3 | 55.6% | 48.1% | -0.01% |
How tight should a flat base be?
Status: textbook partially rejected. Here we defined tightness as the standard deviation of the close divided by the average price. O'Neil teaches that wide and loose bases are dangerous and that tighter bases are better. The directional claim is correct, but the rule overstates the optimum. The third-tightest range of bases outperforms the very tightest quintile by approximately 0.17% in trade returns. Extreme tightness signals a stock with low volatility and low energy; modest tightness signals consolidation with the stock still moving. There is a useful sweet spot just inside the tightness band, not at its extreme.
| Tightness | Obs | Avg. QS | Win Rate | Mkt Beat Rate | Trade Return |
|---|---|---|---|---|---|
| < 2.0% | 347 | 28.8 | 59.9% | 48.4% | 0.25% |
| 2.0% - 3.5% | 6,244 | 29.3 | 57.4% | 45.7% | 0.32% |
| 3.5% - 4.0% | 5,104 | 29.5 | 59.4% | 49.1% | 0.42% |
| 4.0% - 4.5% | 6,489 | 29.5 | 57.0% | 46.9% | 0.26% |
| 4.5% - 5.0% | 6,444 | 29.6 | 57.8% | 48.4% | 0.27% |
| 5.0% - 6.0% | 7,727 | 29.6 | 57.3% | 48.3% | 0.14% |
| > 6.0% | 1,957 | 29.3 | 58.6% | 47.5% | 0.33% |
Prior Uptrend Rule
Status: textbook confirmed. The 30% prior advance rule from the CANSLIM literature holds strongly. While the trade return peaks at 30% range (27.5% - 32.5%), the win rate peaks in the next-higher range (32.5% to 37.5%) and drops from there.
| Prior Advance | Obs | Avg. QS | Win Rate | Mkt Beat Rate | Trade Return |
|---|---|---|---|---|---|
| < 15% | 5,617 | 28.7 | 55.0% | 42.1% | 0.25% |
| 15% - 22.5% | 4,248 | 28.7 | 55.6% | 46.2% | 0.28% |
| 22.5% - 27.5% | 3,563 | 29.1 | 55.0% | 46.3% | 0.14% |
| 27.5% - 32.5% | 3,581 | 29.5 | 60.5% | 51.2% | 0.51% |
| 32.5% - 37.5% | 3,302 | 29.6 | 61.7% | 51.6% | 0.39% |
| > 37.5% | 11,974 | 30.3 | 58.2% | 49.6% | 0.15% |
Volume Contraction Confirms in Moderate Tape, Inverts in Strong Tape
O'Neil's "volume should dry up in the base" rule holds strongly in medium-confidence bull regimes, where bases with declining volume during consolidation outperform bases with neutral or rising volume. In high-confidence bull, the rule inverts: bases with declining volume actually underperform. The same regime-dependence pattern as the prior-uptrend rule.
| Volume Expansion | Obs | Avg. QS | Win Rate | Mkt Beat Rate | Trade Return |
|---|---|---|---|---|---|
| < -7% | 6,866 | 28.8 | 58.0% | 45.8% | 0.36% |
| -7% - 11% | 6,859 | 28.8 | 57.3% | 46.0% | 0.25% |
| 11% - 21% | 6,863 | 29.5 | 57.2% | 47.7% | 0.25% |
| 21% - 30% | 6,868 | 29.9 | 57.0% | 48.3% | 0.23% |
| > 30% | 6,856 | 30.4 | 59.3% | 50.5% | 0.28% |
Several other geometry features were tested without producing meaningful signal: base depth (within the detector's existing tolerance), the R-squared of a 3-month trend fit, and Bollinger band position at detection.
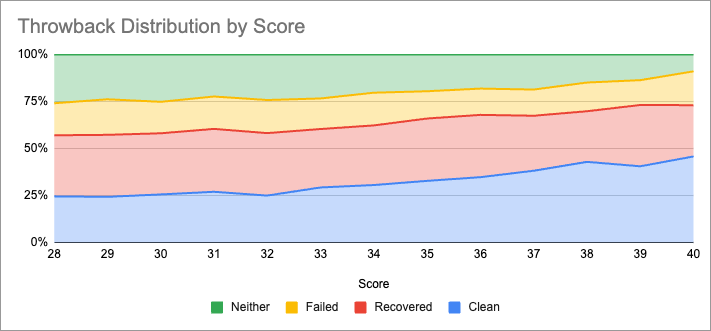
Flat Base Throwback Recovery Rates: 24,000-Trade Breakdown
Bulkowski reports a 45% throwback rate for upward breakouts in bull markets, where a throwback is defined as price returning to the breakout level within a month. Our data classifies trades into a four-category framework that produces a more nuanced picture than the binary clean-versus-throwback split.
Of 24,638 trades that advanced past 1%, 28.4% never threw back at all and produced a 6.58% average return at a 97.9% win rate. Another 32.3% threw back but recovered, producing a 2.89% return at a 78.8% win rate. 16.8% threw back and failed, producing a 2.44% loss at a 27.9% win rate. The remaining 22.6% never advanced meaningfully past the entry and produced a 4.14% loss at an 11.8% win rate.
The throwback rate on advancing trades in our data is 63.3%, well above Bulkowski's 45% reference. But the recovery rate within throwbacks is 65.8%. Two thirds of the trades that pull back through the breakout level go on to recover and finish as winners. This reframes the trader's question. A throwback is not the death of a trade. It is a pricing event with a 65.8% recovery probability.
The practical rule is that exiting on a 1 to 2% pullback by default is mathematically wrong for this pattern. The trader who waits for clearer evidence (the day-2 follow-through signal, for example) makes a better decision than the trader who exits on the first sign of weakness.
Looking at the distribution of the various categories (clean, recovered, failed, neither) you can see that our quality scoring of the model is able to pick up on signals that predict the likelihood of stocks that are never pulling back or that recover. While at a score of 28 about 57% of total detections become successful breakouts, that number increases to 73% for detections with a perfect score.
I believe that pattern detections combined with a success score are a winning formula to develop an edge over the market. This is why every detection we send to our customers is combined with a quality score and an estimated win rate.
Frequently Asked Questions About the Flat Base Pattern
What is a Flat Base Pattern?
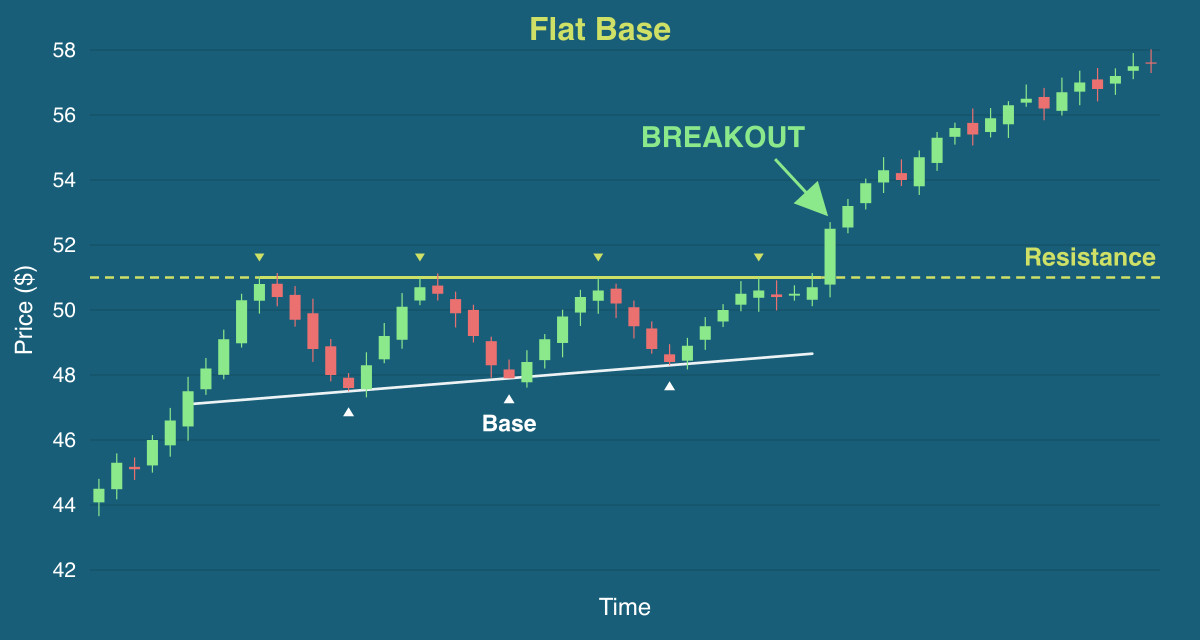
A flat base is a consolidation in which a stock trades sideways in a tight range (typically under 15% deep) for several weeks after a prior advance, before breaking out above the base’s upper boundary. A core CANSLIM/O’Neil setup. Our data shows the optimal base lasts 30 to 40 days.
Does the Flat Base Pattern Actually Work?
The unfiltered flat base is essentially a coin flip, with a 48% win rate and average return near zero across the lowest-quality detections. The pattern only works when filtered. Detections scored 35 or higher win 57% to 76% of the time, with returns climbing from 0.69% to 1.64% per trade. The single shift from trading every detection to trading the highest-quality ones produces the entire economic edge of the pattern.
What Is a Good Win Rate for the Flat Base Pattern?
It depends on how the pattern is filtered. Unfiltered, the win rate is 48% to 50%. With a Pattern Quality Score of 35 or higher, the win rate climbs into the 60s. At score 40, it reaches 76.5%. The strongest combined signal in our dataset, a confirmed day-one with day-two follow-through, wins 82% of the time, with most of that gain produced by the close of day two.
What Pattern Quality Score Should I Look For?
Score 35 is the practical inflection where pattern performance begins to materially improve. Score 38 and above is high-conviction territory. Below score 30, the flat base offers no economic edge and should not be traded as a standalone setup. The relationship between score and outcome is monotonic above 35 and flat below 30.
How Long Should a Flat Base Last?
Our data contradicts the standard "bigger base, higher in space" teaching for the flat base specifically. Win rate by base duration peaks in the 30 to 40-day range at 65.4% and drops sharply past 50 days. Beyond 55 days, win rate falls to 53%. The optimal flat base is shorter than most textbooks suggest.
Does the Flat Base Pattern Work In All Market Conditions?
No. The flat base works in low-confidence and medium-confidence bull regimes and stops working in high-confidence bull tape. At quality score 38, the win rate spread across the three bull regimes is 27 percentage points: 89% in low-confidence bull, 71% in medium-confidence bull, and 62% in high-confidence bull. The CANSLIM rule that breakouts should be traded in strong bull tape is inverted for this pattern.
Should I Exit a Flat Base Trade on a Pullback to the Breakout Level?
No. Two-thirds of trades that pull back through the breakout level go on to recover and finish as winners. The throwback recovery rate across the 24,638 trades that advanced past entry is 65.8%, meaning a default rule of exiting on a 1 to 2% pullback is mathematically wrong for this pattern. Higher-score detections produce more breakouts that never pull back at all, but once a throwback occurs, the recovery probability is largely independent of score.
What Is the Most Important Day-One Signal for Flat Base Trades?
Day-one closing strength is the strongest single day-one signal. A flat base recommendation that closes in the upper 20% of its day-one range wins 70% of the time. A flat base that closes in the lower 20% wins 49%. The 21-point win rate spread is independent of pattern quality, which means closing strength adds information beyond what the score has already captured.
What Is a Day-Two Follow-Through Signal?
Day-two follow-through occurs when a stock closes above its day-one high on at least 90% of day-one volume, after a confirmed day-one (an up close in the upper 70% of the day-one range with relative volume of 1.4 or higher). When both conditions are met, the full-trade win rate is 82.1%. However, by the time the signal is observable, most of the gain has already been captured. Follow-through is a maturity signal, telling the trader the pattern has done its job, not an entry signal.
What This Means For Your Analysis
Distilling the dataset into actionable rules:
Score Is the Foundation. The unfiltered flat base is a coin flip. The scored flat base is not. Score 35 is the practical inflection. Score 38 and above is high-conviction. Below score 30 the pattern offers no economic edge and should not be traded as a standalone setup.
Regime is More Powerful than Score. A score-30 flat base in low-confidence bull tape outperforms a score-40 flat base in high-confidence bull tape. The textbook rule about market direction is inverted for this pattern. If you are looking at a strong bull tape, this is not the time to weight flat base setups heavily.
Day-One Close Strength is the Cheapest Filter you Have. A flat base recommendation that closes in the upper 20% of its day-one range wins 70% of the time. A flat base recommendation that closes in the lower 20% of its day-one range wins 49% of the time. This is a single observation per trade and it adds 21 points of win-rate edge.
Day-Two Follow-Through Is a Maturity Signal. Day-two follow-through is the strongest signal in the dataset, but it is a maturity signal, not an entry signal. When you see follow-through on a confirmed setup, the trade is 96% of the way through its gain. Tighten the stop or take profits. Confirmed setups that have not yet followed through are the ones with the most room left.
Throwbacks Recover More Often than they Fail. Two-thirds of trades that pull back through the breakout level go on to finish as winners. The score's role here is not to make recoveries more likely once a throwback happens (within a category, score barely matters). The score's role is to shift the distribution, with score-40 detections producing successful breakouts (clean or recovered) 73% of the time versus 57% at score 28. Defaulting to an exit on a 1 to 2% pullback costs more than it saves.
Base Shape is Geometry-Specific. The 25 to 45-day duration window. The slight upward slope. The second-tightest quintile of consolidation. These are the geometry conditions where the pattern works best. Outside these windows the pattern works less well, regardless of score.
Treat any Single Setup as a Probabilistic Event. Even at the highest combined conviction (score 40, low-confidence bull, day-one strong close, day-two follow-through), the probability of failure is non-zero. Position sizing and stop placement do most of the work in any system.
What Comes Next
This is the second article in a planned series covering all 16 bullish patterns in our detector. The first, on the Inverse Head and Shoulders, is on the SDA blog.
If you want the full series delivered as it publishes, you should browse our plans. Daily detections are also published at 6 AM Eastern on every trading day.
If you have data of your own that disagrees with anything here, I would like to hear about it. The series exists to surface the gap between what the textbooks say and what 34,312 trades show, and corrections are part of the process.
Disclaimer: StockDataAnalytics.com is a financial data and analytics service. The information provided through our platform, including stock pattern detection, entry zones, stop losses, and price targets, is for informational and educational purposes only and does not constitute financial advice, investment advice, trading advice, or any other type of advice. We are not registered investment advisors, broker-dealers, or financial planners. Past performance of any pattern or recommendation does not guarantee future results. All investments involve risk, including the possible loss of principal. You should consult with a qualified financial advisor before making any investment decisions. By using our service, you acknowledge that all trading decisions are made at your own risk.