
News › Reversal › Inverse Head and Shoulders
Stocks with Inverse Head and Shoulders Pattern
Live results from our daily pattern screener — most recent detection: 2 Oct 2026.
What is an inverse head and shoulders pattern?
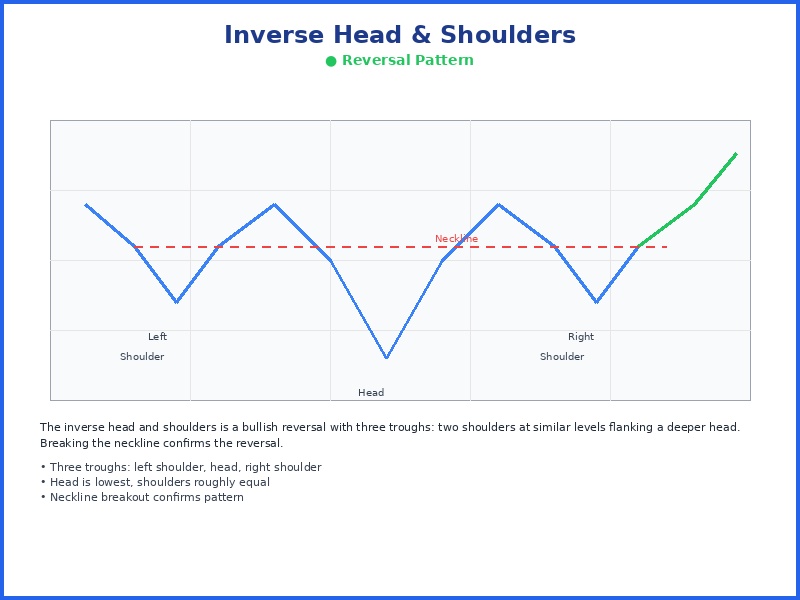
An inverse head and shoulders is a reversal pattern of three troughs — a lower middle trough (the head) flanked by two shallower troughs (the shoulders) — that signals a shift from downtrend to uptrend once price breaks above the neckline.
12 inverse head and shoulders detections in the last 30 days, with projected win rates of 58-63%.
Total detections
82
Last week
0
Last month
12
Last 12 months
82
How reliable is the inverse head and shoulders pattern?
In our most recent backtest (March – September 2026, out-of-sample), 64.5% of the 456 highest-scoring inverse head and shoulders setups, out of 32,450 studied, were trading higher two weeks later. The projected win rate shown on each current detection is a conservative, calibrated estimate derived from that data; we publish the cautious figure rather than the raw historical rate. We score every detection on structure, volume, breakout strength, and risk/reward. How to read inverse head and shoulders setups →
How do I find stocks forming an inverse head and shoulders today?
Our screener scans more than 6,000 NYSE and NASDAQ stocks every trading day and flags new inverse head and shoulders setups before the opening bell. Each detection in the list below shows its entry setup, price target, and stop-loss, most recently on 2 Oct 2026.
Full Detection List
- SIF (SIFCO Industries) Inverse Head And Shoulders, detected on 2 Oct 2026
- UCTT (Ultra Clean) Inverse Head And Shoulders, detected on 1 Oct 2026
- SIF (SIFCO Industries) Inverse Head And Shoulders, detected on 1 Oct 2026
- SIF (SIFCO Industries) Inverse Head And Shoulders, detected on 30 Sep 2026
- ASX (ASE Technology) Inverse Head And Shoulders, detected on 30 Sep 2026
- ISRG (Intuitive Surgical) Inverse Head And Shoulders, detected on 30 Sep 2026
- UCTT (Ultra Clean) Inverse Head And Shoulders, detected on 29 Sep 2026
- IPGP (IPG Photonics) Inverse Head And Shoulders, detected on 29 Sep 2026
- AIN (Albany International) Inverse Head And Shoulders, detected on 29 Sep 2026
- SANM (Sanmina Corp) Inverse Head And Shoulders, detected on 28 Sep 2026
- TDC (Teradata Corp) Inverse Head And Shoulders, detected on 28 Sep 2026
- IPGP (IPG Photonics) Inverse Head And Shoulders, detected on 25 Sep 2026
- UCTT (Ultra Clean) Inverse Head And Shoulders, detected on 24 Sep 2026
- ASX (ASE Technology) Inverse Head And Shoulders, detected on 24 Sep 2026
- DKL (Delek Logistics) Inverse Head And Shoulders, detected on 24 Sep 2026
- IPGP (IPG Photonics) Inverse Head And Shoulders, detected on 23 Sep 2026
- DHI (D.R. Horton) Inverse Head And Shoulders, detected on 23 Sep 2026
- SANM (Sanmina Corp) Inverse Head And Shoulders, detected on 22 Sep 2026
- MOD (Modine Manufacturing) Inverse Head And Shoulders, detected on 22 Sep 2026
- PODD (Insulet Corporation) Inverse Head And Shoulders, detected on 22 Sep 2026
- SANM (Sanmina Corp) Inverse Head And Shoulders, detected on 21 Sep 2026
- MOD (Modine Manufacturing) Inverse Head And Shoulders, detected on 21 Sep 2026
- PODD (Insulet Corporation) Inverse Head And Shoulders, detected on 21 Sep 2026
- IBM (International Business) Inverse Head And Shoulders, detected on 21 Sep 2026
- BAND (Bandwidth Inc) Inverse Head And Shoulders, detected on 18 Sep 2026
- ASX (ASE Technology) Inverse Head And Shoulders, detected on 18 Sep 2026
- PLOW (Douglas Dynamics) Inverse Head And Shoulders, detected on 18 Sep 2026
- SRAD (Sportradar Group) Inverse Head And Shoulders, detected on 17 Sep 2026
- ACI (Albertsons Companies) Inverse Head And Shoulders, detected on 17 Sep 2026
- FLUT (Flutter Entertainment) Inverse Head And Shoulders, detected on 17 Sep 2026
- MOD (Modine Manufacturing) Inverse Head And Shoulders, detected on 16 Sep 2026
- QCOM (Qualcomm Inc) Inverse Head And Shoulders, detected on 16 Sep 2026
- QCOM (Qualcomm Inc) Inverse Head And Shoulders, detected on 15 Sep 2026
- MOD (Modine Manufacturing) Inverse Head And Shoulders, detected on 15 Sep 2026
- TDC (Teradata Corp) Inverse Head And Shoulders, detected on 15 Sep 2026
- MOD (Modine Manufacturing) Inverse Head And Shoulders, detected on 14 Sep 2026
- BAND (Bandwidth Inc) Inverse Head And Shoulders, detected on 11 Sep 2026
- FLUT (Flutter Entertainment) Inverse Head And Shoulders, detected on 11 Sep 2026
- QCOM (Qualcomm Inc) Inverse Head And Shoulders, detected on 10 Sep 2026
- LMND (Lemonade Inc) Inverse Head And Shoulders, detected on 10 Sep 2026
- VRT (Vertiv Holdings) Inverse Head And Shoulders, detected on 9 Sep 2026
- SANM (Sanmina Corp) Inverse Head And Shoulders, detected on 9 Sep 2026
- MOD (Modine Manufacturing) Inverse Head And Shoulders, detected on 9 Sep 2026
- VRT (Vertiv Holdings) Inverse Head And Shoulders, detected on 8 Sep 2026
- QCOM (Qualcomm Inc) Inverse Head And Shoulders, detected on 8 Sep 2026
- LMND (Lemonade Inc) Inverse Head And Shoulders, detected on 28 Aug 2026
- PRIM (Primoris Services) Inverse Head And Shoulders, detected on 18 Aug 2026
- PRIM (Primoris Services) Inverse Head And Shoulders, detected on 12 Aug 2026
- OLLI (Ollies Bargain) Inverse Head And Shoulders, detected on 11 Aug 2026
- PRIM (Primoris Services) Inverse Head And Shoulders, detected on 10 Aug 2026
- BABA (Alibaba Group) Inverse Head And Shoulders, detected on 7 Aug 2026
- PRIM (Primoris Services) Inverse Head And Shoulders, detected on 6 Aug 2026
- OLLI (Ollies Bargain) Inverse Head And Shoulders, detected on 5 Aug 2026
- PRIM (Primoris Services) Inverse Head And Shoulders, detected on 4 Aug 2026
- PRIM (Primoris Services) Inverse Head And Shoulders, detected on 31 Jul 2026
- PUK (Prudential plc) Inverse Head And Shoulders, detected on 9 Jul 2026
- PUK (Prudential plc) Inverse Head And Shoulders, detected on 6 Jul 2026
- PUK (Prudential plc) Inverse Head And Shoulders, detected on 3 Jul 2026
- RDCM (Radcom) Inverse Head And Shoulders, detected on 2 Jul 2026
- SGI (Tempur Sealy) Inverse Head And Shoulders, detected on 24 Jun 2026
- RVLV (Revolve Group) Inverse Head And Shoulders, detected on 23 Jun 2026
- SGI (Tempur Sealy) Inverse Head And Shoulders, detected on 22 Jun 2026
- SGI (Tempur Sealy) Inverse Head And Shoulders, detected on 17 Jun 2026
- EGO (Eldorado Gold) Inverse Head And Shoulders, detected on 3 Jun 2026
- WW (WW International) Inverse Head And Shoulders, detected on 2 Jun 2026
- EGO (Eldorado Gold) Inverse Head And Shoulders, detected on 2 Jun 2026
- RYAM (Rayonier Advanced) Inverse Head And Shoulders, detected on 28 May 2026
- BEPC (Brookfield Renewable) Inverse Head And Shoulders, detected on 26 May 2026
- OKTA (Okta Inc.) Inverse Head And Shoulders, detected on 15 May 2026
- OKTA (Okta Inc.) Inverse Head And Shoulders, detected on 12 May 2026
- AU (AngloGold Ashanti) Inverse Head And Shoulders, detected on 7 May 2026
- GTLB (GitLab Inc.) Inverse Head And Shoulders, detected on 6 May 2026
- INTU (Intuit Inc.) Inverse Head And Shoulders, detected on 6 May 2026
- PI (Impinj Inc.) Inverse Head And Shoulders, detected on 29 Apr 2026
- RYTM (Rhythm Pharmaceuticals) Inverse Head And Shoulders, detected on 28 Apr 2026
- RYTM (Rhythm Pharmaceuticals) Inverse Head And Shoulders, detected on 20 Apr 2026
- VIA (Via Transportation) Inverse Head And Shoulders, detected on 20 Apr 2026
- FROG (JFrog Ltd.) Inverse Head And Shoulders, detected on 8 Apr 2026
- PI (Impinj Inc.) Inverse Head And Shoulders, detected on 8 Apr 2026
- DAL (Delta Air) Inverse Head And Shoulders, detected on 8 Apr 2026
- FROG (JFrog Ltd.) Inverse Head And Shoulders, detected on 7 Apr 2026
- FROG (JFrog Ltd.) Inverse Head And Shoulders, detected on 6 Apr 2026
Browse other patterns
Continuation
Candlestick
Momentum