
News › Candlestick › Bullish Engulfing
Stocks with Bullish Engulfing Pattern
Live results from our daily pattern screener — most recent detection: 2 Oct 2026.
What is a bullish engulfing pattern?
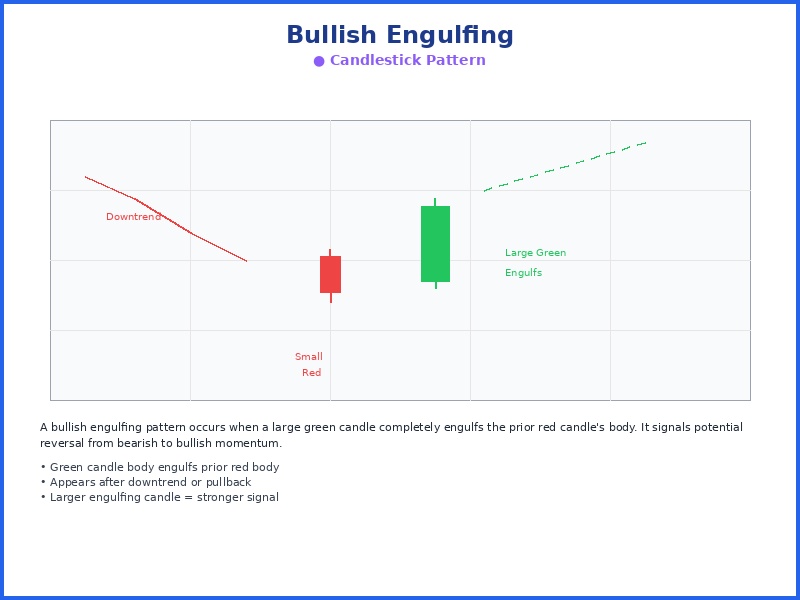
A bullish engulfing is a two-candle reversal pattern in which a large up candle completely engulfs the body of the prior down candle, signaling a momentum shift from sellers to buyers after a downtrend or pullback.
4 bullish engulfing detections in the last 30 days, with projected win rates of 53-54%.
Total detections
58
Last week
0
Last month
4
Last 12 months
58
How reliable is the bullish engulfing pattern?
In our most recent backtest (January – July 2026, out-of-sample), 79% of the 171 highest-scoring bullish engulfing setups, out of 2,040 studied, were trading higher two weeks later. The projected win rate shown on each current detection is a conservative, calibrated estimate derived from that data; we publish the cautious figure rather than the raw historical rate. We score every detection on structure, volume, breakout strength, and risk/reward.
How do I find stocks forming a bullish engulfing today?
Our screener scans more than 6,000 NYSE and NASDAQ stocks every trading day and flags new bullish engulfing setups before the opening bell. Each detection in the list below shows its entry setup, price target, and stop-loss, most recently on 2 Oct 2026.
Learn more about the Bullish Engulfing pattern →
How is a bullish engulfing pattern different from a three white soldiers pattern?
Both are bullish candlestick reversals, but a bullish engulfing is two candles — one large up candle engulfing the prior down candle — while three white soldiers is three consecutive up candles. See three white soldiers setups →
Full Detection List
- ARHS (Arhaus Inc) Bullish Engulfing, detected on 2 Oct 2026
- SVRN (OceanPal Inc) Bullish Engulfing, detected on 25 Sep 2026
- FSLY (Fastly Inc) Bullish Engulfing, detected on 24 Sep 2026
- SBET (SharpLink Gaming) Bullish Engulfing, detected on 23 Sep 2026
- PRE (Prenetics Global) Bullish Engulfing, detected on 24 Aug 2026
- BDSX (Biodesix Inc) Bullish Engulfing, detected on 20 Aug 2026
- RUM (Rumble Inc) Bullish Engulfing, detected on 18 Aug 2026
- BETA (BETA Technologies) Bullish Engulfing, detected on 18 Aug 2026
- SGML (Sigma Lithium) Bullish Engulfing, detected on 17 Aug 2026
- FLY (Firefly Aerospace) Bullish Engulfing, detected on 14 Aug 2026
- TRT (Trio-Tech International) Bullish Engulfing, detected on 14 Aug 2026
- BETA (BETA Technologies) Bullish Engulfing, detected on 12 Aug 2026
- RUM (Rumble Inc) Bullish Engulfing, detected on 12 Aug 2026
- SVM (Silvercorp Metals) Bullish Engulfing, detected on 11 Aug 2026
- RGTIW (Rigetti Computing) Bullish Engulfing, detected on 10 Aug 2026
- POET (POET Technologies) Bullish Engulfing, detected on 7 Aug 2026
- ONTO (Onto Innovation) Bullish Engulfing, detected on 30 Jun 2026
- MTRN (Materion Corp) Bullish Engulfing, detected on 25 Jun 2026
- NINE (Nine Energy) Bullish Engulfing, detected on 23 Jun 2026
- ACVA (ACV Auctions) Bullish Engulfing, detected on 19 Jun 2026
- SDHC (Smith Douglas) Bullish Engulfing, detected on 17 Jun 2026
- CHPT (ChargePoint Holdings) Bullish Engulfing, detected on 5 Jun 2026
- SVV (Savers Value) Bullish Engulfing, detected on 4 Jun 2026
- CLPT (ClearPoint Neuro) Bullish Engulfing, detected on 4 Jun 2026
- CXDO (Crexendo Inc) Bullish Engulfing, detected on 2 Jun 2026
- FGNX (FG Nexus) Bullish Engulfing, detected on 1 Jun 2026
- RGTIW (Rigetti Computing) Bullish Engulfing, detected on 12 May 2026
- SMCI (Super Micro) Bullish Engulfing, detected on 11 May 2026
- RUM (Rumble Inc.) Bullish Engulfing, detected on 11 May 2026
- JOBY (Joby Aviation) Bullish Engulfing, detected on 11 May 2026
- LEGH (Legacy Housing) Bullish Engulfing, detected on 11 May 2026
- BETA (Beta Technologies) Bullish Engulfing, detected on 11 May 2026
- APP (Applovin Corporation) Bullish Engulfing, detected on 8 May 2026
- LEU (Centrus Energy) Bullish Engulfing, detected on 7 May 2026
- AEVA (Aeva Technologies) Bullish Engulfing, detected on 7 May 2026
- WOLF (Wolfspeed Inc.) Bullish Engulfing, detected on 7 May 2026
- XNET (Xunlei Limited) Bullish Engulfing, detected on 7 May 2026
- INOD (Innodata Inc.) Bullish Engulfing, detected on 7 May 2026
- SWIM (Latham Group) Bullish Engulfing, detected on 1 May 2026
- RIOT (Riot Platforms) Bullish Engulfing, detected on 14 Apr 2026
- TSSI (TSS Inc.) Bullish Engulfing, detected on 14 Apr 2026
- MEI (Methode Electronics) Bullish Engulfing, detected on 8 Apr 2026
- RDDT (Reddit Inc.) Bullish Engulfing, detected on 8 Apr 2026
- S (SentinelOne Inc.) Bullish Engulfing, detected on 16 Mar 2026
- XNET (Xunlei Limited) Bullish Engulfing, detected on 16 Mar 2026
- SDHC (Smith Douglas) Bullish Engulfing, detected on 16 Mar 2026
- ELE (Elemental Royalty) Bullish Engulfing, detected on 13 Mar 2026
- FTK (Flotek Industries) Bullish Engulfing, detected on 13 Mar 2026
- HIMS (Hims &) Bullish Engulfing, detected on 12 Mar 2026
- PTRN (Pattern Group) Bullish Engulfing, detected on 11 Mar 2026
- RNAC (Cartesian Therapeutics) Bullish Engulfing, detected on 10 Mar 2026
- LTRX (Lantronix Inc.) Bullish Engulfing, detected on 10 Mar 2026
- ASPI (ASP Isotopes) Bullish Engulfing, detected on 9 Mar 2026
- UNF (Unifirst Corporation) Bullish Engulfing, detected on 6 Mar 2026
- CRGY (Crescent Energy) Bullish Engulfing, detected on 5 Mar 2026
- AII (American Integrity) Bullish Engulfing, detected on 3 Mar 2026
- BOW (Bowhead Specialty) Bullish Engulfing, detected on 26 Feb 2026
- CORZW (Core Scientific) Bullish Engulfing, detected on 25 Feb 2026
Browse other patterns
Continuation
Candlestick
Momentum