News › Continuation › Ascending Triangle
Stocks with Ascending Triangle Pattern
Live results from our daily pattern screener — most recent detection: 24 Jul 2026.
What is an ascending triangle pattern?
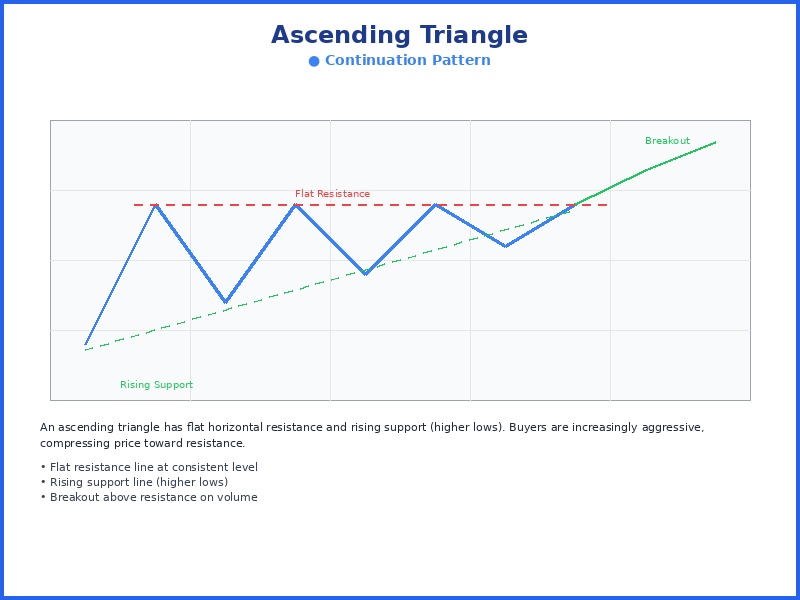
An ascending triangle is a continuation pattern defined by flat horizontal resistance and a rising trendline of higher lows, reflecting buyers who repeatedly step in at higher prices until the stock breaks out above resistance.
5 ascending triangle detections in the last 7 days, with projected win rates of 61-64%.
Total detections
163
Last week
5
Last month
11
Last 12 months
163
How reliable is the ascending triangle pattern?
In our most recent backtest (February 2025 – April 2026), 65.5% of the 644 highest-scoring ascending triangle setups, out of 103,347 studied, were trading higher two weeks later. The projected win rate shown on each current detection is a conservative, calibrated estimate derived from that data; we publish the cautious figure rather than the raw historical rate. We score every detection on structure, volume, breakout strength, and risk/reward. How to read ascending triangle setups →
How do I find stocks forming an ascending triangle today?
Our screener scans more than 6,000 NYSE and NASDAQ stocks every trading day and flags new ascending triangle setups before the opening bell. Each detection in the list below shows its entry setup, price target, and stop-loss, most recently on 24 Jul 2026.
Full Detection List
- NOG (Northern Oil) Ascending Triangle, detected on 24 Jul 2026
- CEG (Constellation Energy) Ascending Triangle, detected on 23 Jul 2026
- SUZ (Suzano S.A.) Ascending Triangle, detected on 23 Jul 2026
- TCOM (Trip.com Group) Ascending Triangle, detected on 22 Jul 2026
- SUZ (Suzano S.A.) Ascending Triangle, detected on 21 Jul 2026
- TME (Tencent Music) Ascending Triangle, detected on 17 Jul 2026
- FLO (Flowers Foods) Ascending Triangle, detected on 16 Jul 2026
- LULU (Lululemon Athletica) Ascending Triangle, detected on 14 Jul 2026
- OI (O-I Glass) Ascending Triangle, detected on 13 Jul 2026
- SRAD (Sportradar Group) Ascending Triangle, detected on 9 Jul 2026
- INSM (Insmed Inc) Ascending Triangle, detected on 3 Jul 2026
- ADMA (Adma Biologics) Ascending Triangle, detected on 25 Jun 2026
- SWIM (Latham Group) Ascending Triangle, detected on 24 Jun 2026
- SMPL (Simply Good) Ascending Triangle, detected on 22 Jun 2026
- TECH (Bio-Techne Corp) Ascending Triangle, detected on 19 Jun 2026
- TECH (Bio-Techne Corp) Ascending Triangle, detected on 18 Jun 2026
- FBIN (Fortune Brands) Ascending Triangle, detected on 16 Jun 2026
- FBIN (Fortune Brands) Ascending Triangle, detected on 11 Jun 2026
- SWIM (Latham Group) Ascending Triangle, detected on 10 Jun 2026
- FBIN (Fortune Brands) Ascending Triangle, detected on 10 Jun 2026
- TECH (Bio-Techne Corp) Ascending Triangle, detected on 9 Jun 2026
- CRMD (CorMedix Inc.) Ascending Triangle, detected on 23 Apr 2026
- MBLY (Mobileye Global) Ascending Triangle, detected on 22 Apr 2026
- MBLY (Mobileye Global) Ascending Triangle, detected on 21 Apr 2026
- PLPC (Preformed Line) Ascending Triangle, detected on 3 Apr 2026
- FROG (JFrog Ltd.) Ascending Triangle, detected on 3 Apr 2026
- SSSS (SuRo Capital) Ascending Triangle, detected on 2 Apr 2026
- ORKA (Oruka Therapeutics) Ascending Triangle, detected on 1 Apr 2026
- SRZN (Surrozen Inc.) Ascending Triangle, detected on 1 Apr 2026
- IBTA (Ibotta Inc.) Ascending Triangle, detected on 1 Apr 2026
- CGON (CG Oncology) Ascending Triangle, detected on 1 Apr 2026
- RDNW (RideNow Group) Ascending Triangle, detected on 1 Apr 2026
- CE (Celanese Corporation) Ascending Triangle, detected on 1 Apr 2026
- NP (Neptune Insurance) Ascending Triangle, detected on 1 Apr 2026
- BWLP (BW LPG) Ascending Triangle, detected on 1 Apr 2026
- SEDG (SolarEdge Technologies) Ascending Triangle, detected on 1 Apr 2026
- CRL (Charles River) Ascending Triangle, detected on 1 Apr 2026
- WLK (Westlake Corporation) Ascending Triangle, detected on 31 Mar 2026
- LYB (LyondellBasell Industries) Ascending Triangle, detected on 31 Mar 2026
- DOW (Dow Inc.) Ascending Triangle, detected on 31 Mar 2026
- PARR (Par Pacific) Ascending Triangle, detected on 30 Mar 2026
- GPRE (Green Plains) Ascending Triangle, detected on 30 Mar 2026
- CRK (Comstock Resources) Ascending Triangle, detected on 30 Mar 2026
- LYB (LyondellBasell Industries) Ascending Triangle, detected on 30 Mar 2026
- CNR (Core Natural) Ascending Triangle, detected on 30 Mar 2026
- VG (Venture Global) Ascending Triangle, detected on 30 Mar 2026
- MRX (Marex Group) Ascending Triangle, detected on 30 Mar 2026
- SRZN (Surrozen Inc.) Ascending Triangle, detected on 30 Mar 2026
- STRO (Sutro Biopharma) Ascending Triangle, detected on 27 Mar 2026
- LXU (LSB Industries) Ascending Triangle, detected on 26 Mar 2026
- TALO (Talos Energy) Ascending Triangle, detected on 26 Mar 2026
- DELL (Dell Technologies) Ascending Triangle, detected on 26 Mar 2026
- AUNA (Auna SA) Ascending Triangle, detected on 26 Mar 2026
- NXT (Nextpower Inc.) Ascending Triangle, detected on 26 Mar 2026
- IBTA (Ibotta Inc.) Ascending Triangle, detected on 26 Mar 2026
- QUIK (QuickLogic Corporation) Ascending Triangle, detected on 26 Mar 2026
- ACLS (Axcelis Technologies) Ascending Triangle, detected on 26 Mar 2026
- AIP (Arteris Inc.) Ascending Triangle, detected on 26 Mar 2026
- FORM (FormFactor Inc.) Ascending Triangle, detected on 26 Mar 2026
- FN (Fabrinet Ordinary) Ascending Triangle, detected on 25 Mar 2026
- PRE (Prenetics Global) Ascending Triangle, detected on 25 Mar 2026
- AMPY (Amplify Energy) Ascending Triangle, detected on 25 Mar 2026
- VIAV (Viavi Solutions) Ascending Triangle, detected on 25 Mar 2026
- MOD (Modine Manufacturing) Ascending Triangle, detected on 25 Mar 2026
- DELL (Dell Technologies) Ascending Triangle, detected on 25 Mar 2026
- ACLS (Axcelis Technologies) Ascending Triangle, detected on 25 Mar 2026
- VECO (Veeco Instruments) Ascending Triangle, detected on 25 Mar 2026
- AHCO (AdaptHealth Corp.) Ascending Triangle, detected on 25 Mar 2026
- UTI (Universal Technical) Ascending Triangle, detected on 24 Mar 2026
- NBR (Nabors Industries) Ascending Triangle, detected on 24 Mar 2026
- RSI (Rush Street) Ascending Triangle, detected on 24 Mar 2026
- TALO (Talos Energy) Ascending Triangle, detected on 23 Mar 2026
- REPX (Ticker: REPX) Ascending Triangle, detected on 23 Mar 2026
- CRGY (Crescent Energy) Ascending Triangle, detected on 23 Mar 2026
- MTDR (Matador Resources) Ascending Triangle, detected on 23 Mar 2026
- WATT (Energous Corporation) Ascending Triangle, detected on 20 Mar 2026
- QUIK (QuickLogic Corporation) Ascending Triangle, detected on 20 Mar 2026
- PTGX (Protagonist Therapeutics) Ascending Triangle, detected on 20 Mar 2026
- TALO (Talos Energy) Ascending Triangle, detected on 20 Mar 2026
- PL (Planet Labs) Ascending Triangle, detected on 20 Mar 2026
- KRMN (Karman Holdings) Ascending Triangle, detected on 20 Mar 2026
- IBTA (Ibotta Inc.) Ascending Triangle, detected on 20 Mar 2026
- NRGU (Ticker: NRGU) Ascending Triangle, detected on 20 Mar 2026
- CLNN (Clene Inc.) Ascending Triangle, detected on 19 Mar 2026
- VIAV (Viavi Solutions) Ascending Triangle, detected on 19 Mar 2026
- FSLY (Fastly Inc.) Ascending Triangle, detected on 19 Mar 2026
- SFM (Sprouts Farmers) Ascending Triangle, detected on 19 Mar 2026
- DK (Delek US) Ascending Triangle, detected on 19 Mar 2026
- TALO (Talos Energy) Ascending Triangle, detected on 19 Mar 2026
- RES (RPC Inc.) Ascending Triangle, detected on 19 Mar 2026
- DOW (Dow Inc.) Ascending Triangle, detected on 19 Mar 2026
- LINC (Lincoln Educational) Ascending Triangle, detected on 18 Mar 2026
- PL (Planet Labs) Ascending Triangle, detected on 18 Mar 2026
- IRDM (Iridium Communications) Ascending Triangle, detected on 18 Mar 2026
- NEXT (NextDecade Corporation) Ascending Triangle, detected on 18 Mar 2026
- VG (Venture Global) Ascending Triangle, detected on 18 Mar 2026
- TRT (Ticker: TRT) Ascending Triangle, detected on 18 Mar 2026
- SYRE (Spyre Therapeutics) Ascending Triangle, detected on 17 Mar 2026
- LASR (nLIGHT Inc.) Ascending Triangle, detected on 17 Mar 2026
- ANRO (Alto Neuroscience) Ascending Triangle, detected on 17 Mar 2026
- DELL (Dell Technologies) Ascending Triangle, detected on 17 Mar 2026
- CAVA (CAVA Group) Ascending Triangle, detected on 17 Mar 2026
- GTE (Ticker: GTE) Ascending Triangle, detected on 17 Mar 2026
- CGON (CG Oncology) Ascending Triangle, detected on 16 Mar 2026
- CLNN (Clene Inc.) Ascending Triangle, detected on 13 Mar 2026
- SI (Shoulder Innovations) Ascending Triangle, detected on 13 Mar 2026
- CE (Celanese Corporation) Ascending Triangle, detected on 13 Mar 2026
- VELO (Velo3D Inc.) Ascending Triangle, detected on 13 Mar 2026
- RES (RPC Inc.) Ascending Triangle, detected on 13 Mar 2026
- NRXS (Ticker: NRXS) Ascending Triangle, detected on 12 Mar 2026
- HPK (HighPeak Energy) Ascending Triangle, detected on 12 Mar 2026
- EGY (VAALCO Energy) Ascending Triangle, detected on 12 Mar 2026
- NRGU (Ticker: NRGU) Ascending Triangle, detected on 12 Mar 2026
- CING (Cingulate Inc.) Ascending Triangle, detected on 11 Mar 2026
- MAZE (Maze Therapeutics) Ascending Triangle, detected on 11 Mar 2026
- AP (Ampco-Pittsburgh Corporation) Ascending Triangle, detected on 11 Mar 2026
- SSL (Sasol Ltd.) Ascending Triangle, detected on 11 Mar 2026
- BETR (Better Home) Ascending Triangle, detected on 11 Mar 2026
- QVCD (QVC Inc.) Ascending Triangle, detected on 11 Mar 2026
- ANRO (Alto Neuroscience) Ascending Triangle, detected on 10 Mar 2026
- CODA (Coda Octopus) Ascending Triangle, detected on 10 Mar 2026
- KRMN (Karman Holdings) Ascending Triangle, detected on 10 Mar 2026
- SSL (Sasol Ltd.) Ascending Triangle, detected on 10 Mar 2026
- PTEN (Patterson-UTI Energy) Ascending Triangle, detected on 10 Mar 2026
- CAVA (CAVA Group) Ascending Triangle, detected on 10 Mar 2026
- IMMX (Immix Biopharma) Ascending Triangle, detected on 9 Mar 2026
- GPRE (Green Plains) Ascending Triangle, detected on 9 Mar 2026
- PHGE (Ticker: PHGE) Ascending Triangle, detected on 9 Mar 2026
- CODA (Coda Octopus) Ascending Triangle, detected on 9 Mar 2026
- DOW (Dow Inc.) Ascending Triangle, detected on 6 Mar 2026
- ACHC (Acadia Healthcare) Ascending Triangle, detected on 6 Mar 2026
- CRC (California Resources) Ascending Triangle, detected on 6 Mar 2026
- ECOR (electroCore Inc.) Ascending Triangle, detected on 5 Mar 2026
- YDDL (One and) Ascending Triangle, detected on 5 Mar 2026
- TATT (TAT Technologies) Ascending Triangle, detected on 5 Mar 2026
- SSRM (SSR Mining) Ascending Triangle, detected on 5 Mar 2026
- GTE (Ticker: GTE) Ascending Triangle, detected on 5 Mar 2026
- DOW (Dow Inc.) Ascending Triangle, detected on 5 Mar 2026
- RELY (Remitly Global) Ascending Triangle, detected on 4 Mar 2026
- TECX (Tectonic Therapeutic) Ascending Triangle, detected on 4 Mar 2026
- INNV (InnovAge Holding) Ascending Triangle, detected on 4 Mar 2026
- GPRE (Green Plains) Ascending Triangle, detected on 4 Mar 2026
- COHR (Coherent Corp.) Ascending Triangle, detected on 3 Mar 2026
- GHM (Graham Corporation) Ascending Triangle, detected on 3 Mar 2026
- PSIG (PS International) Ascending Triangle, detected on 3 Mar 2026
- WOLF (Wolfspeed Inc.) Ascending Triangle, detected on 3 Mar 2026
- LASR (nLIGHT Inc.) Ascending Triangle, detected on 3 Mar 2026
- TSAT (Telesat Corporation) Ascending Triangle, detected on 3 Mar 2026
- BVN (Buenaventura Mining) Ascending Triangle, detected on 2 Mar 2026
- DK (Delek US) Ascending Triangle, detected on 2 Mar 2026
- DRD (DRDGOLD Limited) Ascending Triangle, detected on 2 Mar 2026
- NG (Ticker: NG) Ascending Triangle, detected on 2 Mar 2026
- PPTA (Perpetua Resources) Ascending Triangle, detected on 2 Mar 2026
- TRDA (Entrada Therapeutics) Ascending Triangle, detected on 27 Feb 2026
- VIAV (Viavi Solutions) Ascending Triangle, detected on 26 Feb 2026
- CAMT (Camtek Ltd.) Ascending Triangle, detected on 26 Feb 2026
- Q (Qnity Electronics) Ascending Triangle, detected on 26 Feb 2026
- FIG (Figma Inc.) Ascending Triangle, detected on 26 Feb 2026
- GLW (Corning Incorporated) Ascending Triangle, detected on 24 Feb 2026
- INNV (InnovAge Holding) Ascending Triangle, detected on 24 Feb 2026
- EQX (Ticker: EQX) Ascending Triangle, detected on 24 Feb 2026
- FN (Fabrinet Ordinary) Ascending Triangle, detected on 24 Feb 2026
- AU (AngloGold Ashanti) Ascending Triangle, detected on 24 Feb 2026
Browse other patterns
Continuation
Candlestick
Momentum