News › Continuation › Flat Base
Stocks with Flat Base Pattern
Live results from our daily pattern screener — most recent detection: 20 Jul 2026.
What is a flat base pattern?
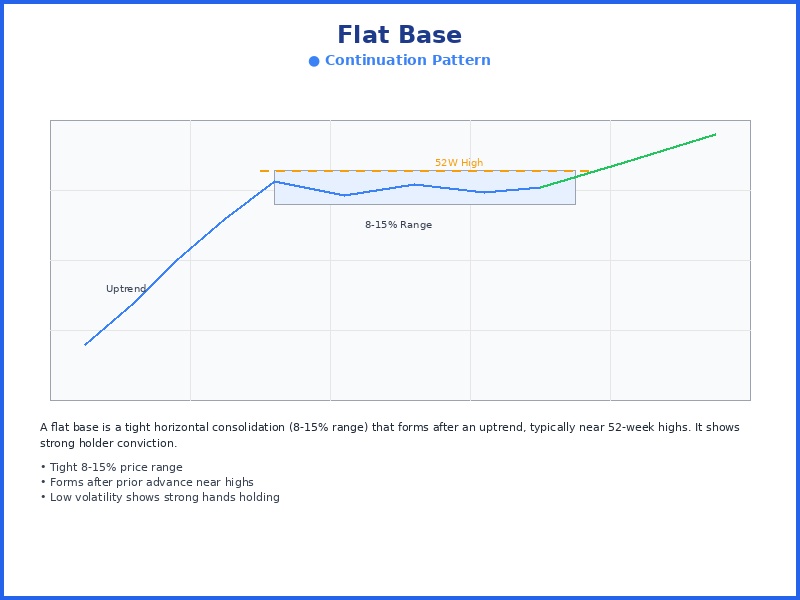
A flat base is a continuation pattern marked by a tight sideways consolidation, usually 8–15% deep, that forms near 52-week highs and reflects holder conviction before a fresh breakout.
2 flat base detections in the last 7 days, with projected win rates of 67-69%.
Total detections
129
Last week
2
Last month
12
Last 12 months
129
How reliable is the flat base pattern?
In our most recent backtest (February 2025 – April 2026), 72% of the 675 highest-scoring flat base setups, out of 33,879 studied, were trading higher two weeks later. The projected win rate shown on each current detection is a conservative, calibrated estimate derived from that data; we publish the cautious figure rather than the raw historical rate. We score every detection on structure, volume, breakout strength, and risk/reward. How to read flat base setups →
How do I find stocks forming a flat base today?
Our screener scans more than 6,000 NYSE and NASDAQ stocks every trading day and flags new flat base setups before the opening bell. Each detection in the list below shows its entry setup, price target, and stop-loss, most recently on 20 Jul 2026.
Full Detection List
- CRSR (Corsair Gaming) Flat Base, detected on 20 Jul 2026
- NVO (Novo Nordisk) Flat Base, detected on 20 Jul 2026
- HCA (HCA Healthcare) Flat Base, detected on 8 Jul 2026
- EMBJ (Embraer S.A.) Flat Base, detected on 3 Jul 2026
- MHK (Mohawk Industries) Flat Base, detected on 2 Jul 2026
- NSIT (Insight Enterprises) Flat Base, detected on 2 Jul 2026
- NU (Nu Holdings) Flat Base, detected on 1 Jul 2026
- WSC (WillScot Mobile) Flat Base, detected on 1 Jul 2026
- HEI (Heico Corp) Flat Base, detected on 30 Jun 2026
- WSC (WillScot Mobile) Flat Base, detected on 30 Jun 2026
- WSC (WillScot Mobile) Flat Base, detected on 29 Jun 2026
- A (Agilent Technologies) Flat Base, detected on 26 Jun 2026
- THC (Tenet Healthcare) Flat Base, detected on 25 Jun 2026
- OSK (Oshkosh Corp) Flat Base, detected on 24 Jun 2026
- SYNA (Synaptics Inc) Flat Base, detected on 23 Jun 2026
- PNFP (Pinnacle Financial) Flat Base, detected on 23 Jun 2026
- MTD (Mettler-Toledo International) Flat Base, detected on 22 Jun 2026
- MTD (Mettler-Toledo International) Flat Base, detected on 19 Jun 2026
- COR (Cencora Inc) Flat Base, detected on 18 Jun 2026
- RGLD (Royal Gold) Flat Base, detected on 18 Jun 2026
- PNFP (Pinnacle Financial) Flat Base, detected on 17 Jun 2026
- BLBD (Blue Bird) Flat Base, detected on 17 Jun 2026
- AFRM (Affirm Holdings) Flat Base, detected on 16 Jun 2026
- SGI (Tempur Sealy) Flat Base, detected on 15 Jun 2026
- LAD (Lithia Motors) Flat Base, detected on 10 Jun 2026
- PNFP (Pinnacle Financial) Flat Base, detected on 8 Jun 2026
- PNFP (Pinnacle Financial) Flat Base, detected on 5 Jun 2026
- PII (Polaris Inc) Flat Base, detected on 4 Jun 2026
- BXP (Boston Properties) Flat Base, detected on 3 Jun 2026
- WS (Worthington Steel) Flat Base, detected on 2 Jun 2026
- VC (Visteon Corp) Flat Base, detected on 1 Jun 2026
- PNFP (Pinnacle Financial) Flat Base, detected on 1 Jun 2026
- PII (Polaris Inc.) Flat Base, detected on 29 May 2026
- JEF (Jefferies Financial) Flat Base, detected on 29 May 2026
- NXRT (NexPoint Residential) Flat Base, detected on 29 May 2026
- WOR (Worthington Enterprises) Flat Base, detected on 28 May 2026
- KRC (Kilroy Realty) Flat Base, detected on 28 May 2026
- VC (Visteon Corporation) Flat Base, detected on 27 May 2026
- PII (Polaris Inc.) Flat Base, detected on 26 May 2026
- VNO (Vornado Realty) Flat Base, detected on 26 May 2026
- PNFP (Pinnacle Financial) Flat Base, detected on 26 May 2026
- SNPS (Synopsys Inc.) Flat Base, detected on 19 May 2026
- AVGO (Broadcom Inc.) Flat Base, detected on 19 May 2026
- SNPS (Synopsys Inc.) Flat Base, detected on 18 May 2026
- CDNS (Cadence Design) Flat Base, detected on 18 May 2026
- SNPS (Synopsys Inc.) Flat Base, detected on 13 May 2026
- AVGO (Broadcom Inc.) Flat Base, detected on 13 May 2026
- EL (Estee Lauder) Flat Base, detected on 11 May 2026
- DKS (Dick's Sporting) Flat Base, detected on 11 May 2026
- WOR (Worthington Enterprises) Flat Base, detected on 7 May 2026
- ANGO (AngioDynamics Inc.) Flat Base, detected on 6 May 2026
- BOOT (Boot Barn) Flat Base, detected on 5 May 2026
- LNN (Lindsay Corporation) Flat Base, detected on 5 May 2026
- SOLS (Solstice Advanced) Flat Base, detected on 5 May 2026
- PTRN (Pattern Group) Flat Base, detected on 5 May 2026
- PANW (Palo Alto) Flat Base, detected on 4 May 2026
- JEF (Jefferies Financial) Flat Base, detected on 4 May 2026
- HNI (HNI Corporation) Flat Base, detected on 4 May 2026
- NSA (National Storage) Flat Base, detected on 4 May 2026
- CRBG (Corebridge Financial) Flat Base, detected on 1 May 2026
- WAL (Western Alliance) Flat Base, detected on 1 May 2026
- XFLT (XAI Octagon) Flat Base, detected on 1 May 2026
- NSA (National Storage) Flat Base, detected on 1 May 2026
- PESI (Perma-Fix Environmental) Flat Base, detected on 1 May 2026
- PUBM (PubMatic Inc.) Flat Base, detected on 30 Apr 2026
- OMF (OneMain Holdings) Flat Base, detected on 30 Apr 2026
- WAL (Western Alliance) Flat Base, detected on 30 Apr 2026
- AGM (Federal Agricultural) Flat Base, detected on 30 Apr 2026
- EXP (Eagle Materials) Flat Base, detected on 29 Apr 2026
- TTAM (Titan America) Flat Base, detected on 29 Apr 2026
- ZD (Ziff Davis) Flat Base, detected on 29 Apr 2026
- SOLS (Solstice Advanced) Flat Base, detected on 28 Apr 2026
- CVCO (Cavco Industries) Flat Base, detected on 27 Apr 2026
- CECO (CECO Environmental) Flat Base, detected on 27 Apr 2026
- HNI (HNI Corporation) Flat Base, detected on 27 Apr 2026
- EXP (Eagle Materials) Flat Base, detected on 27 Apr 2026
- BIDU (Baidu Inc.) Flat Base, detected on 27 Apr 2026
- CGNX (Cognex Corporation) Flat Base, detected on 27 Apr 2026
- DSGR (Distribution Solutions) Flat Base, detected on 27 Apr 2026
- NSA (National Storage) Flat Base, detected on 27 Apr 2026
- XFLT (XAI Octagon) Flat Base, detected on 27 Apr 2026
- IRON (Disc Medicine) Flat Base, detected on 23 Apr 2026
- CRL (Charles River) Flat Base, detected on 23 Apr 2026
- EXP (Eagle Materials) Flat Base, detected on 23 Apr 2026
- OMF (OneMain Holdings) Flat Base, detected on 23 Apr 2026
- CVCO (Cavco Industries) Flat Base, detected on 23 Apr 2026
- ZD (Ziff Davis) Flat Base, detected on 23 Apr 2026
- GOOS (Canada Goose) Flat Base, detected on 22 Apr 2026
- PVLA (Palvella Therapeutics) Flat Base, detected on 22 Apr 2026
- IRON (Disc Medicine) Flat Base, detected on 21 Apr 2026
- CBRE (CBRE Group) Flat Base, detected on 21 Apr 2026
- CRL (Charles River) Flat Base, detected on 21 Apr 2026
- ELV (Elevance Health) Flat Base, detected on 21 Apr 2026
- SHOP (Shopify Inc.) Flat Base, detected on 20 Apr 2026
- BIDU (Baidu Inc.) Flat Base, detected on 20 Apr 2026
- RAL (Ralliant Corporation) Flat Base, detected on 20 Apr 2026
- CGNX (Cognex Corporation) Flat Base, detected on 20 Apr 2026
- HNI (HNI Corporation) Flat Base, detected on 20 Apr 2026
- GLBE (Global-E Online) Flat Base, detected on 17 Apr 2026
- CPRI (Capri Holdings) Flat Base, detected on 17 Apr 2026
- NVT (nVent Electric) Flat Base, detected on 16 Apr 2026
- XYZ (Block Inc.) Flat Base, detected on 16 Apr 2026
- OMF (OneMain Holdings) Flat Base, detected on 16 Apr 2026
- TBBK (The Bancorp) Flat Base, detected on 16 Apr 2026
- CRL (Charles River) Flat Base, detected on 16 Apr 2026
- MRCY (Mercury Systems) Flat Base, detected on 15 Apr 2026
- LTM (LATAM Airlines) Flat Base, detected on 15 Apr 2026
- CRL (Charles River) Flat Base, detected on 14 Apr 2026
- AAON (AAON Inc.) Flat Base, detected on 14 Apr 2026
- TTAM (Titan America) Flat Base, detected on 14 Apr 2026
- RAL (Ralliant Corporation) Flat Base, detected on 14 Apr 2026
- CGNX (Cognex Corporation) Flat Base, detected on 14 Apr 2026
- ELV (Elevance Health) Flat Base, detected on 14 Apr 2026
- IPGP (IPG Photonics) Flat Base, detected on 13 Apr 2026
- FUTU (Futu Holdings) Flat Base, detected on 13 Apr 2026
- AGM (Federal Agricultural) Flat Base, detected on 13 Apr 2026
- RAL (Ralliant Corporation) Flat Base, detected on 13 Apr 2026
- KE (Kimball Electronics) Flat Base, detected on 13 Apr 2026
- UHAL (U-Haul Holding) Flat Base, detected on 13 Apr 2026
- ARDX (Ardelyx Inc.) Flat Base, detected on 13 Apr 2026
- CVCO (Cavco Industries) Flat Base, detected on 13 Apr 2026
- PJT (PJT Partners) Flat Base, detected on 13 Apr 2026
- DSGN (Design Therapeutics) Flat Base, detected on 17 Mar 2026
- XRPC (Canary XRP) Flat Base, detected on 17 Mar 2026
- KRT (Karat Packaging) Flat Base, detected on 16 Mar 2026
- YPF (YPF Sociedad) Flat Base, detected on 12 Mar 2026
- RERE (ATRenew Inc.) Flat Base, detected on 11 Mar 2026
- AGRO (Adecoagro S.A.) Flat Base, detected on 5 Mar 2026
- UTHR (United Therapeutics) Flat Base, detected on 26 Feb 2026
Browse other patterns
Candlestick
Momentum