News › Momentum › Breakaway Gap
Stocks with Breakaway Gap Pattern
Live results from our daily pattern screener — most recent detection: 19 Jun 2026.
What is a breakaway gap pattern?
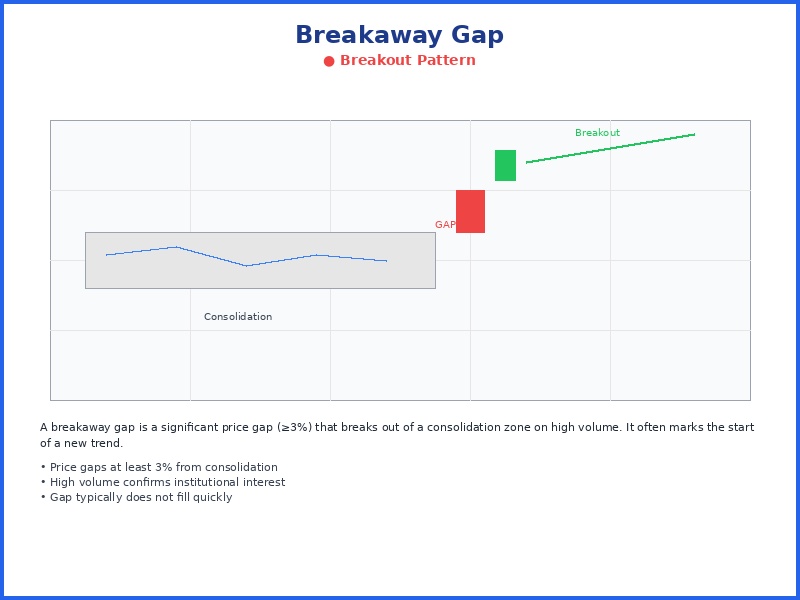
A breakaway gap is a momentum pattern in which price opens sharply above the prior session's range, typically 3% or more on heavy volume, and holds the gap, signaling the start or continuation of a strong directional move.
6 breakaway gap detections on record.
Total detections
6
Last week
0
Last month
0
Last 12 months
6
How reliable is the breakaway gap pattern?
The projected win rate shown on each breakaway gap detection is a conservative, calibrated estimate of how often similar past setups were trading higher two weeks later. Reliability also varies with overall market conditions, no chart pattern works in isolation. We score every detection on structure, volume, breakout strength, and risk/reward.
How do I find stocks forming a breakaway gap today?
Our screener scans more than 6,000 NYSE and NASDAQ stocks every trading day and flags new breakaway gap setups before the opening bell. Each detection in the list below shows its entry setup, price target, and stop-loss, most recently on 19 Jun 2026.
Full Detection List
- BFLY (Butterfly Network) Breakaway Gap, detected on 19 Jun 2026
- MRVL (Marvell Technology) Breakaway Gap, detected on 3 Jun 2026
- XENE (Xenon Pharmaceuticals) Breakaway Gap, detected on 10 Mar 2026
- WSR (Whitestone REIT) Breakaway Gap, detected on 10 Mar 2026
- WSR (Whitestone REIT) Breakaway Gap, detected on 9 Mar 2026
- BW (Babcock &) Breakaway Gap, detected on 6 Mar 2026
Browse other patterns
Continuation
Candlestick
Momentum