News › Reversal › Post-Collapse Recovery
Stocks with Post-Collapse Recovery Pattern
Live results from our daily pattern screener — most recent detection: 30 Jul 2026.
What is a post-collapse recovery pattern?
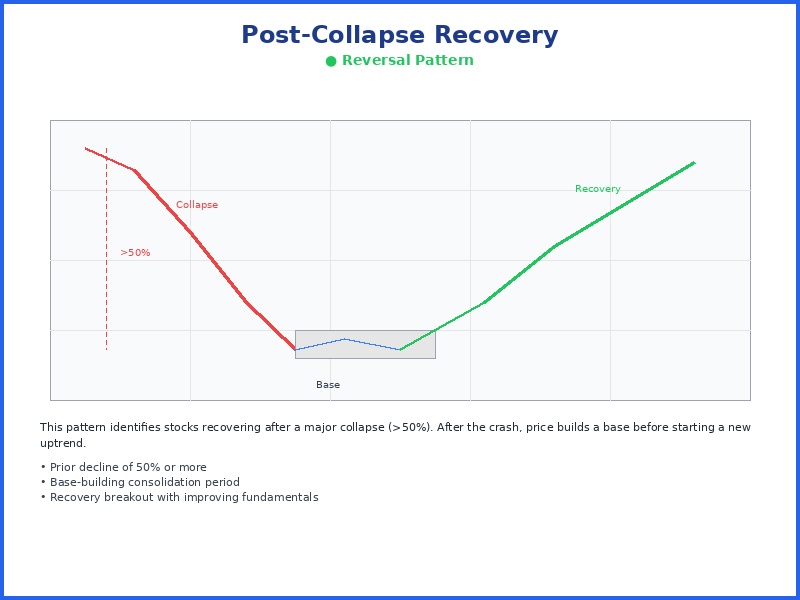
A post-collapse recovery is a reversal pattern in which a stock that has fallen 50% or more from its highs forms a base and begins making higher lows, signaling a potential transition from a deep downtrend toward a new uptrend.
5 post-collapse recovery detections in the last 7 days, with projected win rates of 67-71%.
Total detections
49
Last week
5
Last month
22
Last 12 months
49
How reliable is the post-collapse recovery pattern?
The projected win rate shown on each post-collapse recovery detection is a conservative, calibrated estimate of how often similar past setups were trading higher two weeks later. Reliability also varies with overall market conditions, no chart pattern works in isolation. We score every detection on structure, volume, breakout strength, and risk/reward.
How do I find stocks forming a post-collapse recovery today?
Our screener scans more than 6,000 NYSE and NASDAQ stocks every trading day and flags new post-collapse recovery setups before the opening bell. Each detection in the list below shows its entry setup, price target, and stop-loss, most recently on 30 Jul 2026.
Full Detection List
- CDRE (Cadre Holdings) Post Collapse Recovery, detected on 30 Jul 2026
- GAP (Gap Inc) Post Collapse Recovery, detected on 29 Jul 2026
- DXC (DXC Technology) Post Collapse Recovery, detected on 27 Jul 2026
- HBM (Hudbay Minerals) Post Collapse Recovery, detected on 24 Jul 2026
- KKR (KKR &) Post Collapse Recovery, detected on 23 Jul 2026
- QDEL (QuidelOrtho Corporation) Post Collapse Recovery, detected on 21 Jul 2026
- DXC (DXC Technology) Post Collapse Recovery, detected on 20 Jul 2026
- ANL (Adlai Nortye) Post Collapse Recovery, detected on 17 Jul 2026
- CRSR (Corsair Gaming) Post Collapse Recovery, detected on 17 Jul 2026
- ARDT (Ardent Health) Post Collapse Recovery, detected on 16 Jul 2026
- MBLY (Mobileye Global) Post Collapse Recovery, detected on 16 Jul 2026
- QDEL (QuidelOrtho Corporation) Post Collapse Recovery, detected on 15 Jul 2026
- DXC (DXC Technology) Post Collapse Recovery, detected on 13 Jul 2026
- KKR (KKR &) Post Collapse Recovery, detected on 13 Jul 2026
- ARDT (Ardent Health) Post Collapse Recovery, detected on 10 Jul 2026
- VST (Vistra Corp) Post Collapse Recovery, detected on 10 Jul 2026
- RIVN (Rivian Automotive) Post Collapse Recovery, detected on 9 Jul 2026
- QDEL (QuidelOrtho Corporation) Post Collapse Recovery, detected on 8 Jul 2026
- MBLY (Mobileye Global) Post Collapse Recovery, detected on 8 Jul 2026
- MBLY (Mobileye Global) Post Collapse Recovery, detected on 2 Jul 2026
- MBLY (Mobileye Global) Post Collapse Recovery, detected on 1 Jul 2026
- USAU (U.S. Gold) Post Collapse Recovery, detected on 30 Jun 2026
- TFPM (Triple Flag) Post Collapse Recovery, detected on 29 Jun 2026
- ETOR (Etoro Group) Post Collapse Recovery, detected on 26 Jun 2026
- SHOP (Shopify Inc) Post Collapse Recovery, detected on 23 Jun 2026
- ARHS (Arhaus Inc) Post Collapse Recovery, detected on 22 Jun 2026
- ONEW (Onewater Marine) Post Collapse Recovery, detected on 22 Jun 2026
- NNE (Nano Nuclear) Post Collapse Recovery, detected on 19 Jun 2026
- RIVN (Rivian Automotive) Post Collapse Recovery, detected on 18 Jun 2026
- PYPL (PayPal Holdings) Post Collapse Recovery, detected on 17 Jun 2026
- IP (International Paper) Post Collapse Recovery, detected on 16 Jun 2026
- DXC (DXC Technology) Post Collapse Recovery, detected on 15 Jun 2026
- ALK (Alaska Air) Post Collapse Recovery, detected on 11 Jun 2026
- AXON (Axon Enterprise) Post Collapse Recovery, detected on 11 Jun 2026
- COMP (Compass Inc) Post Collapse Recovery, detected on 11 Jun 2026
- SHOP (Shopify Inc) Post Collapse Recovery, detected on 11 Jun 2026
- COMP (Compass Inc) Post Collapse Recovery, detected on 10 Jun 2026
- ONEW (Onewater Marine) Post Collapse Recovery, detected on 10 Jun 2026
- CODA (Coda Octopus) Post Collapse Recovery, detected on 10 Jun 2026
- FSLY (Fastly Inc) Post Collapse Recovery, detected on 9 Jun 2026
- HOOD (Robinhood Markets) Post Collapse Recovery, detected on 8 Jun 2026
- TMC (TMC the) Post Collapse Recovery, detected on 22 May 2026
- BKSY (BlackSky Technology) Post Collapse Recovery, detected on 6 Apr 2026
- LUCK (Lucky Strike) Post Collapse Recovery, detected on 6 Apr 2026
- AGIO (Agios Pharmaceuticals) Post Collapse Recovery, detected on 2 Apr 2026
- FBYD (Falcon's Beyond) Post Collapse Recovery, detected on 31 Mar 2026
- CAR (Avis Budget) Post Collapse Recovery, detected on 27 Mar 2026
- ALTS (ALT5 Sigma) Post Collapse Recovery, detected on 23 Mar 2026
- UUU (Ticker: UUU) Post Collapse Recovery, detected on 19 Mar 2026
Browse other patterns
Continuation
Candlestick
Momentum