News › Momentum › Volatility Compression
Stocks with Volatility Compression Pattern
Live results from our daily pattern screener — most recent detection: 30 Jul 2026.
What is a volatility compression pattern?
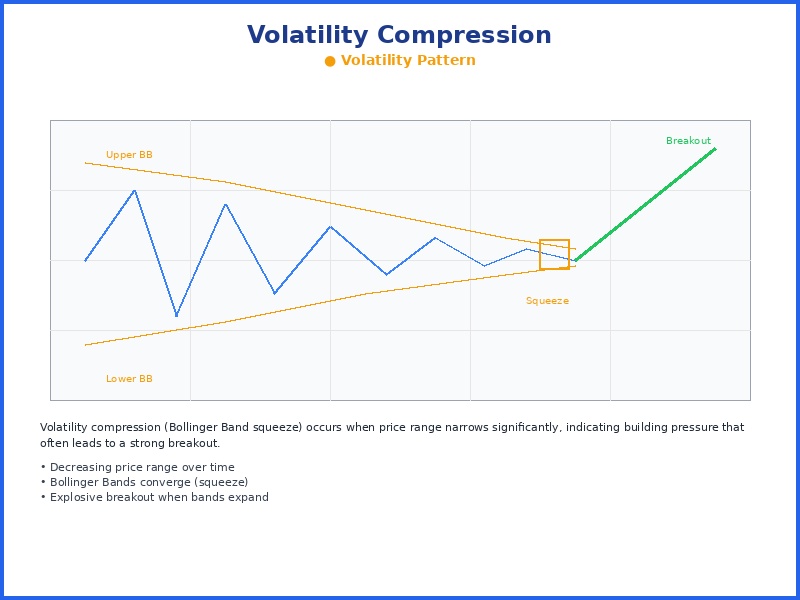
Volatility compression, also called a Bollinger Band squeeze, is a momentum pattern in which a stock's trading range narrows sharply over a sustained period, building up pressure that frequently releases as an explosive breakout.
2 volatility compression detections in the last 7 days, with projected win rate of 69%.
Total detections
15
Last week
2
Last month
9
Last 12 months
15
How reliable is the volatility compression pattern?
In our most recent backtest (February 2025 – April 2026), 73.6% of the 53 highest-scoring volatility compression setups, out of 17,515 studied, were trading higher two weeks later. The projected win rate shown on each current detection is a conservative, calibrated estimate derived from that data; we publish the cautious figure rather than the raw historical rate. We score every detection on structure, volume, breakout strength, and risk/reward. How to read volatility compression setups →
How do I find stocks forming a volatility compression today?
Our screener scans more than 6,000 NYSE and NASDAQ stocks every trading day and flags new volatility compression setups before the opening bell. Each detection in the list below shows its entry setup, price target, and stop-loss, most recently on 30 Jul 2026.
Full Detection List
- OSCR (Oscar Health) Volatility Compression, detected on 30 Jul 2026
- WLY (John Wiley) Volatility Compression, detected on 28 Jul 2026
- SPB (Spectrum Brands) Volatility Compression, detected on 20 Jul 2026
- ELAN (Elanco Animal) Volatility Compression, detected on 17 Jul 2026
- RLGT (Radiant Logistics) Volatility Compression, detected on 17 Jul 2026
- SPB (Spectrum Brands) Volatility Compression, detected on 16 Jul 2026
- RXO (RXO Inc) Volatility Compression, detected on 15 Jul 2026
- CHRW (C.H. Robinson) Volatility Compression, detected on 2 Jul 2026
- EXEL (Exelixis Inc) Volatility Compression, detected on 1 Jul 2026
- LIVN (LivaNova PLC) Volatility Compression, detected on 26 Jun 2026
- LFUS (Littelfuse Inc) Volatility Compression, detected on 19 Jun 2026
- PRMB (Primo Brands) Volatility Compression, detected on 15 Jun 2026
- SYRE (Spyre Therapeutics) Volatility Compression, detected on 11 Jun 2026
- ASTH (Apollo Medical) Volatility Compression, detected on 9 Jun 2026
- INFU (Ticker: INFU) Volatility Compression, detected on 25 Feb 2026
Browse other patterns
Continuation
Candlestick
Momentum