
News › Continuation › Cup and Handle
Stocks with Cup and Handle Pattern
Live results from our daily pattern screener — most recent detection: 24 Aug 2026.
What is a cup and handle pattern?
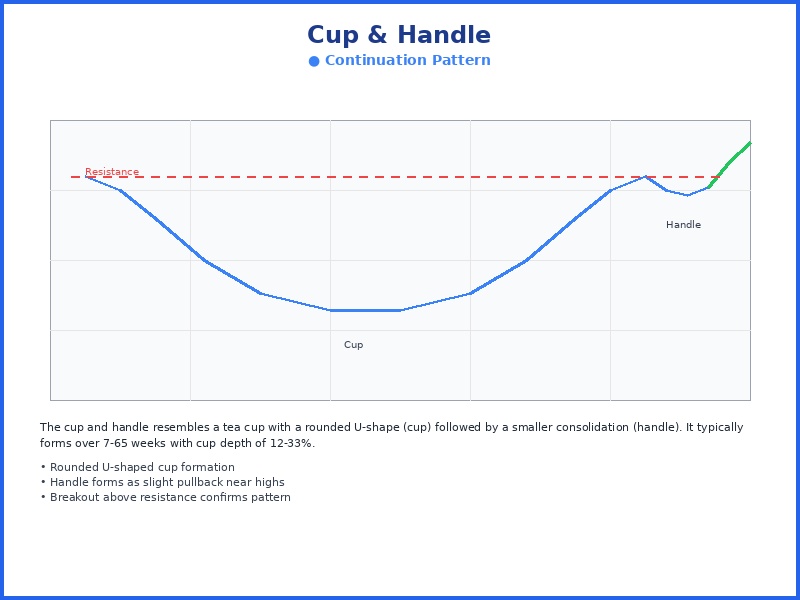
A cup and handle is a continuation pattern in which price forms a rounded, U-shaped base (the cup) followed by a shorter, shallower pullback (the handle), often preceding a breakout above the cup's prior resistance.
24 cup and handle detections on record.
Total detections
24
Last week
0
Last month
0
Last 12 months
24
How reliable is the cup and handle pattern?
In our most recent backtest (March – September 2026, out-of-sample), 54.7% of the 614 highest-scoring cup and handle setups, out of 6,234 studied, were trading higher two weeks later. The projected win rate shown on each current detection is a conservative, calibrated estimate derived from that data; we publish the cautious figure rather than the raw historical rate. We score every detection on structure, volume, breakout strength, and risk/reward.
How do I find stocks forming a cup and handle today?
Our screener scans more than 6,000 NYSE and NASDAQ stocks every trading day and flags new cup and handle setups before the opening bell. Each detection in the list below shows its entry setup, price target, and stop-loss, most recently on 24 Aug 2026.
Learn more about the Cup and Handle pattern →
How is a cup and handle pattern different from a rounding bottom pattern?
Both include a rounded base, but a cup and handle adds a short pullback (the handle) near the old high before breaking out, while a rounding bottom breaks out directly from the curve. See rounding bottom setups →
Full Detection List
- ASMB (Assembly Biosciences) Cup Handle, detected on 24 Aug 2026
- TASK (TaskUs Inc) Cup Handle, detected on 20 Aug 2026
- COHU (Cohu Inc) Cup Handle, detected on 19 Aug 2026
- FRPT (Freshpet Inc) Cup Handle, detected on 13 Aug 2026
- ARES (Ares Management) Cup Handle, detected on 13 Aug 2026
- IMNM (Immunome Inc) Cup Handle, detected on 7 Aug 2026
- CRCT (Cricut Inc) Cup Handle, detected on 6 Aug 2026
- MANH (Manhattan Associates) Cup Handle, detected on 5 Aug 2026
- RHI (Robert Half) Cup Handle, detected on 8 Jul 2026
- MOH (Molina Healthcare) Cup Handle, detected on 7 Jul 2026
- MAN (ManpowerGroup) Cup Handle, detected on 6 Jul 2026
- RHI (Robert Half) Cup Handle, detected on 2 Jul 2026
- BROS (Dutch Bros) Cup Handle, detected on 1 Jul 2026
- ADPT (Adaptive Biotechnologies) Cup Handle, detected on 26 Jun 2026
- AYI (Acuity Brands) Cup Handle, detected on 26 Jun 2026
- ALGT (Allegiant Travel) Cup Handle, detected on 25 Jun 2026
- SUPV (Grupo Supervielle) Cup Handle, detected on 18 Jun 2026
- RHI (Robert Half) Cup Handle, detected on 8 Jun 2026
- VCYT (Veracyte Inc) Cup Handle, detected on 4 Jun 2026
- ARRY (Array Technologies) Cup Handle, detected on 3 Jun 2026
- VCYT (Veracyte Inc) Cup Handle, detected on 1 Jun 2026
- BCRX (BioCryst Pharmaceuticals) Cup Handle, detected on 17 Mar 2026
- LYB (LyondellBasell Industries) Cup Handle, detected on 6 Mar 2026
- CRGY (Crescent Energy) Cup Handle, detected on 2 Mar 2026
Browse other patterns
Reversal
Candlestick
Momentum