
News › Reversal › Falling Wedge
Stocks with Falling Wedge Pattern
Live results from our daily pattern screener — most recent detection: 23 Oct 2026.
What is a falling wedge pattern?
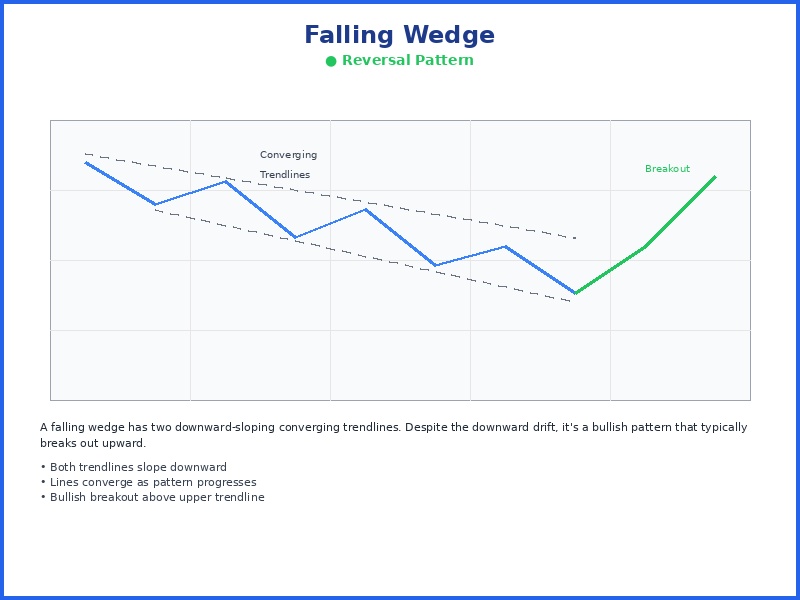
A falling wedge is a bullish pattern in which price declines between two downward-sloping, converging trendlines; the narrowing range signals fading selling pressure, and the pattern typically resolves with a breakout above the upper trendline.
9 falling wedge detections in the last 7 days, with projected win rates of 72-85%.
Total detections
60
Last week
9
Last month
41
Last 12 months
60
How reliable is the falling wedge pattern?
In our most recent backtest (March – September 2026, out-of-sample), 78.3% of the 1,541 highest-scoring falling wedge setups, out of 46,891 studied, were trading higher two weeks later. The projected win rate shown on each current detection is a conservative, calibrated estimate derived from that data; we publish the cautious figure rather than the raw historical rate. We score every detection on structure, volume, breakout strength, and risk/reward.
How do I find stocks forming a falling wedge today?
Our screener scans more than 6,000 NYSE and NASDAQ stocks every trading day and flags new falling wedge setups before the opening bell. Each detection in the list below shows its entry setup, price target, and stop-loss, most recently on 23 Oct 2026.
Learn more about the Falling Wedge pattern →
How is a falling wedge pattern different from a symmetrical triangle pattern?
Both squeeze price between converging trendlines, but in a falling wedge both lines slope downward and the expected break is upward, while a symmetrical triangle has one falling and one rising line and can break in either direction. See symmetrical triangle setups →
Full Detection List
- BDSX (Biodesix Inc) Falling Wedge, detected on 23 Oct 2026
- ERII (Energy Recovery) Falling Wedge, detected on 22 Oct 2026
- NXT (Nextpower Inc) Falling Wedge, detected on 21 Oct 2026
- JMSB (John Marshall) Falling Wedge, detected on 20 Oct 2026
- UMH (UMH Properties) Falling Wedge, detected on 20 Oct 2026
- GUG (Guggenheim Active) Falling Wedge, detected on 19 Oct 2026
- WRLD (World Acceptance) Falling Wedge, detected on 19 Oct 2026
- GASS (StealthGas Inc) Falling Wedge, detected on 19 Oct 2026
- MSGE (Madison Square) Falling Wedge, detected on 16 Oct 2026
- VIRT (Virtu Financial) Falling Wedge, detected on 15 Oct 2026
- REYN (Reynolds Consumer) Falling Wedge, detected on 15 Oct 2026
- TEO (Telecom Argentina) Falling Wedge, detected on 14 Oct 2026
- XV (Simplify Exchange) Falling Wedge, detected on 13 Oct 2026
- EC (Ecopetrol SA) Falling Wedge, detected on 12 Oct 2026
- VRT (Vertiv Holdings) Falling Wedge, detected on 5 Oct 2026
- MEI (Methode Electronics) Falling Wedge, detected on 2 Oct 2026
- AAOI (Applied Optoelectronics) Falling Wedge, detected on 2 Oct 2026
- DUOT (Duos Technologies) Falling Wedge, detected on 2 Oct 2026
- FTW (Presidio Production) Falling Wedge, detected on 2 Oct 2026
- KBDC (Kayne Anderson) Falling Wedge, detected on 1 Oct 2026
- AR (Antero Resources) Falling Wedge, detected on 1 Oct 2026
- OSS (One Stop) Falling Wedge, detected on 1 Oct 2026
- UPST (Upstart Holdings) Falling Wedge, detected on 1 Oct 2026
- RH (RH -) Falling Wedge, detected on 30 Sep 2026
- MGY (Magnolia Oil) Falling Wedge, detected on 30 Sep 2026
- FTAI (FTAI Aviation) Falling Wedge, detected on 30 Sep 2026
- CORZW (Core Scientific) Falling Wedge, detected on 30 Sep 2026
- AIO (Virtus Artificial) Falling Wedge, detected on 29 Sep 2026
- SSB (SouthState Corporation) Falling Wedge, detected on 29 Sep 2026
- TRMK (Trustmark Corp) Falling Wedge, detected on 29 Sep 2026
- NXPI (NXP Semiconductors) Falling Wedge, detected on 28 Sep 2026
- HTH (Hilltop Holdings) Falling Wedge, detected on 28 Sep 2026
- CPK (Chesapeake Utilities) Falling Wedge, detected on 28 Sep 2026
- FIBK (First Interstate) Falling Wedge, detected on 28 Sep 2026
- RIG (Transocean Ltd) Falling Wedge, detected on 25 Sep 2026
- KBDC (Kayne Anderson) Falling Wedge, detected on 25 Sep 2026
- WWD (Woodward Inc) Falling Wedge, detected on 25 Sep 2026
- WDAY (Workday Inc) Falling Wedge, detected on 24 Sep 2026
- KOP (Koppers Holdings) Falling Wedge, detected on 24 Sep 2026
- APLD (Applied Digital) Falling Wedge, detected on 23 Sep 2026
- ARLO (Arlo Technologies) Falling Wedge, detected on 23 Sep 2026
- VSAT (Viasat Inc) Falling Wedge, detected on 22 Sep 2026
- JCI (Johnson Controls) Falling Wedge, detected on 22 Sep 2026
- VSAT (Viasat Inc) Falling Wedge, detected on 21 Sep 2026
- SLF (Sun Life) Falling Wedge, detected on 21 Sep 2026
- HMC (Honda Motor) Falling Wedge, detected on 18 Sep 2026
- ANDE (Andersons Inc) Falling Wedge, detected on 18 Sep 2026
- SYM (Symbotic Inc) Falling Wedge, detected on 17 Sep 2026
- ANET (Arista Networks) Falling Wedge, detected on 17 Sep 2026
- MET (Metlife Inc) Falling Wedge, detected on 16 Sep 2026
- SIRI (Sirius XM) Falling Wedge, detected on 16 Sep 2026
- NOG (Northern Oil) Falling Wedge, detected on 15 Sep 2026
- SIRI (Sirius XM) Falling Wedge, detected on 15 Sep 2026
- MSM (MSC Industrial) Falling Wedge, detected on 14 Sep 2026
- TLK (Telkom Indonesia) Falling Wedge, detected on 11 Sep 2026
- PLMR (Palomar Holdings) Falling Wedge, detected on 11 Sep 2026
- UVE (Universal Insurance) Falling Wedge, detected on 10 Sep 2026
- TLK (Telkom Indonesia) Falling Wedge, detected on 9 Sep 2026
- OI (O-I Glass) Falling Wedge, detected on 8 Sep 2026
- C (Citigroup Inc) Falling Wedge, detected on 17 Aug 2026
Browse other patterns
Continuation
Candlestick
Momentum