News › Continuation › Symmetrical Triangle
Stocks with Symmetrical Triangle Pattern
Live results from our daily pattern screener — most recent detection: 9 Jul 2026.
What is a symmetrical triangle pattern?
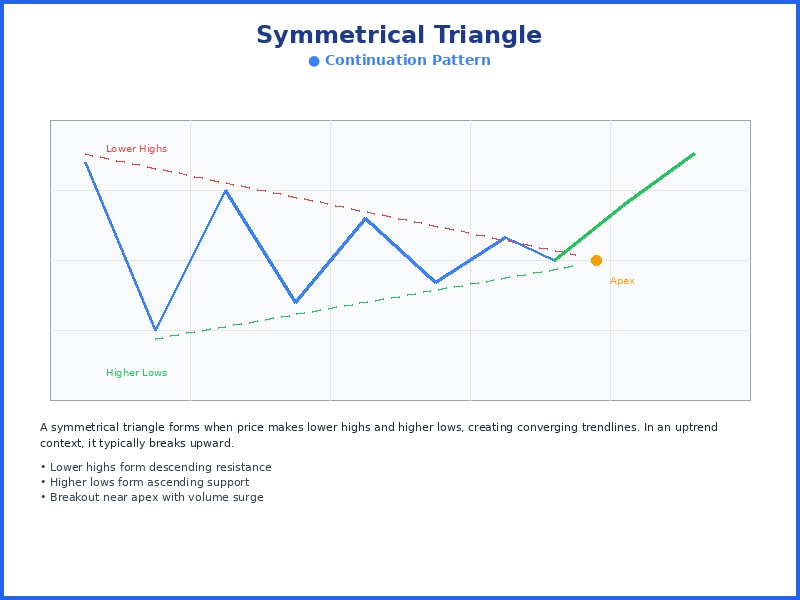
A symmetrical triangle is a consolidation pattern formed by lower highs and higher lows converging toward an apex; in an uptrend it typically resolves to the upside on an expansion in volume.
9 symmetrical triangle detections in the last 30 days, with projected win rates of 58-67%.
Total detections
50
Last week
0
Last month
9
Last 12 months
50
How reliable is the symmetrical triangle pattern?
In our most recent backtest (February 2025 – April 2026), 75% of the 72 highest-scoring symmetrical triangle setups, out of 32,650 studied, were trading higher two weeks later. The projected win rate shown on each current detection is a conservative, calibrated estimate derived from that data; we publish the cautious figure rather than the raw historical rate. We score every detection on structure, volume, breakout strength, and risk/reward. How to read symmetrical triangle setups →
How do I find stocks forming a symmetrical triangle today?
Our screener scans more than 6,000 NYSE and NASDAQ stocks every trading day and flags new symmetrical triangle setups before the opening bell. Each detection in the list below shows its entry setup, price target, and stop-loss, most recently on 9 Jul 2026.
Learn more about the Symmetrical Triangle pattern →
How is a symmetrical triangle pattern different from a bullish pennant pattern?
Both contract between converging trendlines, but a symmetrical triangle builds over a longer base, while a bullish pennant is a brief consolidation immediately after a sharp advance. See bullish pennant setups →
Full Detection List
- UHS (Universal Health) Symmetrical Triangle, detected on 9 Jul 2026
- GPK (Graphic Packaging) Symmetrical Triangle, detected on 7 Jul 2026
- EFX (Equifax Inc) Symmetrical Triangle, detected on 3 Jul 2026
- TGLS (Tecnoglass Inc) Symmetrical Triangle, detected on 2 Jul 2026
- PI (Impinj Inc) Symmetrical Triangle, detected on 1 Jul 2026
- ES (Eversource Energy) Symmetrical Triangle, detected on 1 Jul 2026
- UTZ (Utz Brands) Symmetrical Triangle, detected on 30 Jun 2026
- ITRI (Itron Inc) Symmetrical Triangle, detected on 30 Jun 2026
- SYK (Stryker Corp) Symmetrical Triangle, detected on 26 Jun 2026
- ABT (Abbott Laboratories) Symmetrical Triangle, detected on 25 Jun 2026
- ABT (Abbott Laboratories) Symmetrical Triangle, detected on 24 Jun 2026
- GPC (Genuine Parts) Symmetrical Triangle, detected on 22 Jun 2026
- IR (Ingersoll-Rand Inc) Symmetrical Triangle, detected on 19 Jun 2026
- FOXF (Fox Factory) Symmetrical Triangle, detected on 19 Jun 2026
- GPC (Genuine Parts) Symmetrical Triangle, detected on 18 Jun 2026
- TGLS (Tecnoglass Inc) Symmetrical Triangle, detected on 17 Jun 2026
- GPC (Genuine Parts) Symmetrical Triangle, detected on 16 Jun 2026
- ARHS (Arhaus Inc) Symmetrical Triangle, detected on 15 Jun 2026
- SSB (SouthState Corporation) Symmetrical Triangle, detected on 8 Jun 2026
- FNB (F.N.B. Corp) Symmetrical Triangle, detected on 5 Jun 2026
- DXPE (DXP Enterprises) Symmetrical Triangle, detected on 4 Jun 2026
- AGCO (AGCO Corp) Symmetrical Triangle, detected on 4 Jun 2026
- LII (Lennox International) Symmetrical Triangle, detected on 3 Jun 2026
- LII (Lennox International) Symmetrical Triangle, detected on 2 Jun 2026
- PRGO (Perrigo Company) Symmetrical Triangle, detected on 1 Jun 2026
- CSW (CSW Industrials) Symmetrical Triangle, detected on 28 May 2026
- WWW (Wolverine World) Symmetrical Triangle, detected on 28 May 2026
- JBI (Janus International) Symmetrical Triangle, detected on 27 May 2026
- LOAR (Loar Holdings) Symmetrical Triangle, detected on 27 May 2026
- QFIN (Qfin Holdings) Symmetrical Triangle, detected on 4 May 2026
- EXPI (eXp World) Symmetrical Triangle, detected on 21 Apr 2026
- STVN (Stevanato Group) Symmetrical Triangle, detected on 20 Apr 2026
- BRO (Brown &) Symmetrical Triangle, detected on 17 Apr 2026
- STEM (Stem Inc.) Symmetrical Triangle, detected on 16 Apr 2026
- BIRK (Birkenstock Holding) Symmetrical Triangle, detected on 14 Apr 2026
- BOW (Bowhead Specialty) Symmetrical Triangle, detected on 13 Apr 2026
- TNK (Teekay Tankers) Symmetrical Triangle, detected on 3 Apr 2026
- NRT (North European) Symmetrical Triangle, detected on 3 Apr 2026
- INSW (International Seaways) Symmetrical Triangle, detected on 3 Apr 2026
- EVMN (Evommune Inc.) Symmetrical Triangle, detected on 3 Apr 2026
- ASC (Ardmore Shipping) Symmetrical Triangle, detected on 3 Apr 2026
- ANRO (Alto Neuroscience) Symmetrical Triangle, detected on 2 Apr 2026
- ANF (Abercrombie &) Symmetrical Triangle, detected on 2 Apr 2026
- KTB (Kontoor Brands) Symmetrical Triangle, detected on 2 Apr 2026
- HSHP (Himalaya Shipping) Symmetrical Triangle, detected on 2 Apr 2026
- MGM (MGM Resorts) Symmetrical Triangle, detected on 27 Feb 2026
- ELTX (Elicio Therapeutics) Symmetrical Triangle, detected on 26 Feb 2026
- INTT (Ticker: INTT) Symmetrical Triangle, detected on 26 Feb 2026
- ALB (Albemarle Corporation) Symmetrical Triangle, detected on 25 Feb 2026
- SA (Seabridge Gold) Symmetrical Triangle, detected on 25 Feb 2026
Browse other patterns
Continuation
Candlestick
Momentum