
News › Continuation › Bullish Pennant
Stocks with Bullish Pennant Pattern
Live results from our daily pattern screener — most recent detection: 12 Oct 2026.
What is a bullish pennant pattern?
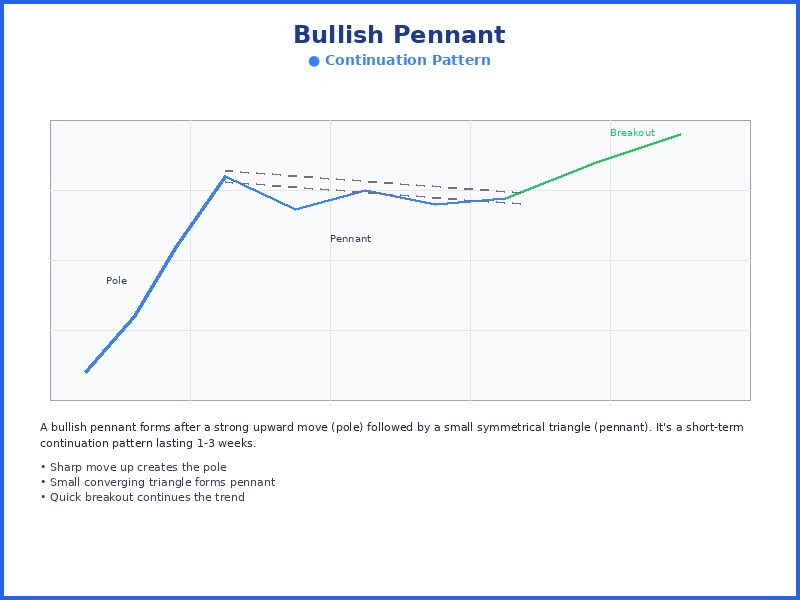
A bullish pennant is a continuation pattern that forms when a strong rally pauses in a small symmetrical triangle of converging trendlines, typically resolving with a breakout that continues the prior advance.
12 bullish pennant detections in the last 30 days, with projected win rates of 66-67%.
Total detections
162
Last week
0
Last month
12
Last 12 months
162
How reliable is the bullish pennant pattern?
In our most recent backtest (March – September 2026, out-of-sample), 61.9% of the 9,201 highest-scoring bullish pennant setups, out of 104,282 studied, were trading higher two weeks later. The projected win rate shown on each current detection is a conservative, calibrated estimate derived from that data; we publish the cautious figure rather than the raw historical rate. We score every detection on structure, volume, breakout strength, and risk/reward.
How do I find stocks forming a bullish pennant today?
Our screener scans more than 6,000 NYSE and NASDAQ stocks every trading day and flags new bullish pennant setups before the opening bell. Each detection in the list below shows its entry setup, price target, and stop-loss, most recently on 12 Oct 2026.
Learn more about the Bullish Pennant pattern →
How is a bullish pennant pattern different from a bull flag pattern?
Both are brief continuation pauses after a strong advance, but a bullish pennant forms a small converging triangle, while a bull flag forms a parallel, slightly downward-sloping channel. See bull flag setups →
How is a bullish pennant pattern different from a symmetrical triangle pattern?
Both consolidate between converging trendlines, but a bullish pennant is a short pause right after a sharp move, while a symmetrical triangle is a larger, longer-building base. See symmetrical triangle setups →
Full Detection List
- LPTH (Lightpath Technologies) Bullish Pennant, detected on 12 Oct 2026
- IE (Ivanhoe Electric) Bullish Pennant, detected on 12 Oct 2026
- VPG (Vishay Precision) Bullish Pennant, detected on 9 Oct 2026
- AKTX (Akari Therapeutics) Bullish Pennant, detected on 9 Oct 2026
- GFR (Greenfire Resources) Bullish Pennant, detected on 8 Oct 2026
- AKTX (Akari Therapeutics) Bullish Pennant, detected on 8 Oct 2026
- MRAM (Everspin Technologies) Bullish Pennant, detected on 7 Oct 2026
- DAL (Delta Air) Bullish Pennant, detected on 7 Oct 2026
- CLYM (Eliem Therapeutics) Bullish Pennant, detected on 6 Oct 2026
- IE (Ivanhoe Electric) Bullish Pennant, detected on 6 Oct 2026
- EBS (Emergent Biosolutions) Bullish Pennant, detected on 5 Oct 2026
- GLSI (Greenwich LifeSciences) Bullish Pennant, detected on 5 Oct 2026
- NOK (Nokia Corp) Bullish Pennant, detected on 2 Sep 2026
- BNAI (Brand Engagement) Bullish Pennant, detected on 24 Aug 2026
- CRDO (Credo Technology) Bullish Pennant, detected on 20 Aug 2026
- IMOS (Chipmos Technologies) Bullish Pennant, detected on 19 Aug 2026
- ORCL (Oracle Corp) Bullish Pennant, detected on 18 Aug 2026
- KC (Kingsoft Cloud) Bullish Pennant, detected on 18 Aug 2026
- ONDS (Ondas Holdings) Bullish Pennant, detected on 17 Aug 2026
- HCA (HCA Healthcare) Bullish Pennant, detected on 17 Aug 2026
- SMTC (Semtech Corp) Bullish Pennant, detected on 14 Aug 2026
- BABA (Alibaba Group) Bullish Pennant, detected on 14 Aug 2026
- AOSL (Alpha &) Bullish Pennant, detected on 13 Aug 2026
- MRVL (Marvell Technology) Bullish Pennant, detected on 13 Aug 2026
- BNED (Barnes &) Bullish Pennant, detected on 13 Aug 2026
- AOSL (Alpha &) Bullish Pennant, detected on 12 Aug 2026
- DBI (Designer Brands) Bullish Pennant, detected on 12 Aug 2026
- PENG (Penguin Solutions) Bullish Pennant, detected on 11 Aug 2026
- CABO (Cable One) Bullish Pennant, detected on 11 Aug 2026
- AEYE (AudioEye Inc) Bullish Pennant, detected on 10 Aug 2026
- SNX (TD Synnex) Bullish Pennant, detected on 10 Aug 2026
- HIMX (Himax Technologies) Bullish Pennant, detected on 7 Aug 2026
- VSH (Vishay Intertechnology) Bullish Pennant, detected on 7 Aug 2026
- AORT (Artivion Inc) Bullish Pennant, detected on 6 Aug 2026
- AMAT (Applied Materials) Bullish Pennant, detected on 6 Aug 2026
- ACMR (ACM Research) Bullish Pennant, detected on 5 Aug 2026
- OPTX (Syntec Optics) Bullish Pennant, detected on 5 Aug 2026
- AORT (Artivion Inc) Bullish Pennant, detected on 5 Aug 2026
- DMRC (Digimarc Corporation) Bullish Pennant, detected on 4 Aug 2026
- LOAR (Loar Holdings) Bullish Pennant, detected on 4 Aug 2026
- KGEI (Kolibri Global) Bullish Pennant, detected on 3 Aug 2026
- ASYS (Amtech Systems) Bullish Pennant, detected on 24 Jul 2026
- FLEX (Flex Ltd) Bullish Pennant, detected on 24 Jul 2026
- QUBT (Quantum Computing) Bullish Pennant, detected on 23 Jul 2026
- GSIT (GSI Technology) Bullish Pennant, detected on 23 Jul 2026
- VPG (Vishay Precision) Bullish Pennant, detected on 23 Jul 2026
- CXDO (Crexendo Inc) Bullish Pennant, detected on 10 Jul 2026
- HIMX (Himax Technologies) Bullish Pennant, detected on 9 Jul 2026
- HMY (Harmony Gold) Bullish Pennant, detected on 9 Jul 2026
- GFI (Gold Fields) Bullish Pennant, detected on 8 Jul 2026
- SHAK (Shake Shack) Bullish Pennant, detected on 7 Jul 2026
- PH (Parker-Hannifin Corp) Bullish Pennant, detected on 6 Jul 2026
- PH (Parker-Hannifin Corp) Bullish Pennant, detected on 3 Jul 2026
- WOLF (Wolfspeed Inc) Bullish Pennant, detected on 2 Jul 2026
- RL (Ralph Lauren) Bullish Pennant, detected on 1 Jul 2026
- RL (Ralph Lauren) Bullish Pennant, detected on 30 Jun 2026
- LUXE (MYT Netherlands) Bullish Pennant, detected on 26 Jun 2026
- POET (POET Technologies) Bullish Pennant, detected on 25 Jun 2026
- WOLF (Wolfspeed Inc) Bullish Pennant, detected on 25 Jun 2026
- RGEN (Repligen Corp) Bullish Pennant, detected on 24 Jun 2026
- CRNC (Cerence Inc) Bullish Pennant, detected on 24 Jun 2026
- ASPN (Aspen Aerogels) Bullish Pennant, detected on 24 Jun 2026
- WING (Wingstop Inc) Bullish Pennant, detected on 23 Jun 2026
- IONQ (IonQ Inc) Bullish Pennant, detected on 23 Jun 2026
- AMPX (Amprius Technologies) Bullish Pennant, detected on 22 Jun 2026
- AMPX (Amprius Technologies) Bullish Pennant, detected on 19 Jun 2026
- USAS (Americas Gold) Bullish Pennant, detected on 18 Jun 2026
- ULH (Universal Logistics) Bullish Pennant, detected on 17 Jun 2026
- FLS (Flowserve Corp) Bullish Pennant, detected on 8 Jun 2026
- MHK (Mohawk Industries) Bullish Pennant, detected on 5 Jun 2026
- PLPC (Preformed Line) Bullish Pennant, detected on 4 Jun 2026
- AERO (Grupo Aeromexico) Bullish Pennant, detected on 4 Jun 2026
- MHK (Mohawk Industries) Bullish Pennant, detected on 3 Jun 2026
- AXSM (Axsome Therapeutics) Bullish Pennant, detected on 3 Jun 2026
- FGI (FGI Industries) Bullish Pennant, detected on 2 Jun 2026
- CNQ (Canadian Natural) Bullish Pennant, detected on 2 Jun 2026
- TPB (Turning Point) Bullish Pennant, detected on 1 Jun 2026
- KIDS (OrthoPediatrics Corp) Bullish Pennant, detected on 1 Jun 2026
- USAU (U.S. Gold) Bullish Pennant, detected on 19 May 2026
- JBIO (Jade Biosciences) Bullish Pennant, detected on 19 May 2026
- OPTX (Syntec Optics) Bullish Pennant, detected on 15 May 2026
- PLAY (Dave &) Bullish Pennant, detected on 13 May 2026
- BRCB (Black Rock) Bullish Pennant, detected on 12 May 2026
- MMYT (MakeMyTrip Limited) Bullish Pennant, detected on 11 May 2026
- RGLD (Royal Gold) Bullish Pennant, detected on 11 May 2026
- FWRG (First Watch) Bullish Pennant, detected on 6 May 2026
- ADPT (Adaptive Biotechnologies) Bullish Pennant, detected on 6 May 2026
- RH (RH Common) Bullish Pennant, detected on 5 May 2026
- NVMI (Nova Ltd.) Bullish Pennant, detected on 1 May 2026
- MPAA (Motorcar Parts) Bullish Pennant, detected on 1 May 2026
- PGY (Pagaya Technologies) Bullish Pennant, detected on 30 Apr 2026
- AMWD (American Woodmark) Bullish Pennant, detected on 30 Apr 2026
- XNET (Xunlei Limited) Bullish Pennant, detected on 30 Apr 2026
- META (Meta Platforms) Bullish Pennant, detected on 29 Apr 2026
- TWI (Titan International) Bullish Pennant, detected on 29 Apr 2026
- ORN (Orion Group) Bullish Pennant, detected on 29 Apr 2026
- IPX (IperionX Limited) Bullish Pennant, detected on 29 Apr 2026
- AU (AngloGold Ashanti) Bullish Pennant, detected on 29 Apr 2026
- ENR (Energizer Holdings) Bullish Pennant, detected on 28 Apr 2026
- AIR (AAR Corp.) Bullish Pennant, detected on 28 Apr 2026
- USAU (U.S. Gold) Bullish Pennant, detected on 28 Apr 2026
- AS (Amer Sports) Bullish Pennant, detected on 28 Apr 2026
- BWMN (Bowman Consulting) Bullish Pennant, detected on 28 Apr 2026
- PROF (Profound Medical) Bullish Pennant, detected on 28 Apr 2026
- AU (AngloGold Ashanti) Bullish Pennant, detected on 28 Apr 2026
- BHVN (Biohaven Ltd.) Bullish Pennant, detected on 28 Apr 2026
- EXK (Endeavour Silver) Bullish Pennant, detected on 27 Apr 2026
- SHC (Sotera Health) Bullish Pennant, detected on 24 Apr 2026
- TPVG (TriplePoint Venture) Bullish Pennant, detected on 24 Apr 2026
- JEF (Jefferies Financial) Bullish Pennant, detected on 24 Apr 2026
- OWLT (Owlet Inc.) Bullish Pennant, detected on 23 Apr 2026
- SDHC (Smith Douglas) Bullish Pennant, detected on 23 Apr 2026
- BWMN (Bowman Consulting) Bullish Pennant, detected on 23 Apr 2026
- GTES (Gates Industrial) Bullish Pennant, detected on 22 Apr 2026
- ASA (ASA Gold) Bullish Pennant, detected on 22 Apr 2026
- KGC (Kinross Gold) Bullish Pennant, detected on 22 Apr 2026
- ARDX (Ardelyx Inc.) Bullish Pennant, detected on 22 Apr 2026
- PAAS (Pan American) Bullish Pennant, detected on 22 Apr 2026
- B (Barrick Mining) Bullish Pennant, detected on 17 Apr 2026
- FULC (Fulcrum Therapeutics) Bullish Pennant, detected on 14 Apr 2026
- LGN (Legence Corp.) Bullish Pennant, detected on 10 Apr 2026
- CXW (CoreCivic Inc.) Bullish Pennant, detected on 18 Mar 2026
- TROX (Tronox Holdings) Bullish Pennant, detected on 18 Mar 2026
- RKLB (Rocket Lab) Bullish Pennant, detected on 18 Mar 2026
- RFIL (RF Industries) Bullish Pennant, detected on 18 Mar 2026
- PUMP (ProPetro Holding) Bullish Pennant, detected on 13 Mar 2026
- WATT (Energous Corporation) Bullish Pennant, detected on 12 Mar 2026
- NVTS (Navitas Semiconductor) Bullish Pennant, detected on 12 Mar 2026
- ATMV (AlphaVest Acquisition) Bullish Pennant, detected on 12 Mar 2026
- EVLV (Evolv Technologies) Bullish Pennant, detected on 12 Mar 2026
- ACDC (ProFrac Holding) Bullish Pennant, detected on 11 Mar 2026
- TECX (Tectonic Therapeutic) Bullish Pennant, detected on 9 Mar 2026
- UAN (CVR Partners) Bullish Pennant, detected on 9 Mar 2026
- MUSA (Murphy USA) Bullish Pennant, detected on 9 Mar 2026
- ATLC (Atlanticus Holdings) Bullish Pennant, detected on 6 Mar 2026
- LXU (LSB Industries) Bullish Pennant, detected on 5 Mar 2026
- INNV (InnovAge Holding) Bullish Pennant, detected on 5 Mar 2026
- NG (Ticker: NG) Bullish Pennant, detected on 3 Mar 2026
- NERV (Minerva Neurosciences) Bullish Pennant, detected on 3 Mar 2026
- PNRG (PrimeEnergy Resources) Bullish Pennant, detected on 3 Mar 2026
- AAOI (Applied Optoelectronics) Bullish Pennant, detected on 2 Mar 2026
- XRAY (DENTSPLY SIRONA) Bullish Pennant, detected on 2 Mar 2026
- PENN (PENN Entertainment) Bullish Pennant, detected on 2 Mar 2026
- TIGO (Millicom International) Bullish Pennant, detected on 2 Mar 2026
- MEG (Montrose Environmental) Bullish Pennant, detected on 27 Feb 2026
- ANIK (Anika Therapeutics) Bullish Pennant, detected on 27 Feb 2026
- GLOO (Gloo Holdings) Bullish Pennant, detected on 27 Feb 2026
- LXU (LSB Industries) Bullish Pennant, detected on 27 Feb 2026
- PENN (PENN Entertainment) Bullish Pennant, detected on 27 Feb 2026
- OPRA (Opera Limited) Bullish Pennant, detected on 27 Feb 2026
- EFXT (Enerflex Ltd) Bullish Pennant, detected on 27 Feb 2026
- TPC (Tutor Perini) Bullish Pennant, detected on 27 Feb 2026
- CAVA (CAVA Group) Bullish Pennant, detected on 26 Feb 2026
- DRTS (Alpha Tau) Bullish Pennant, detected on 26 Feb 2026
- ARMP (Ticker: ARMP) Bullish Pennant, detected on 25 Feb 2026
- SHIP (Seanergy Maritime) Bullish Pennant, detected on 25 Feb 2026
- ESTA (Establishment Labs) Bullish Pennant, detected on 25 Feb 2026
- ALMU (Aeluma Inc.) Bullish Pennant, detected on 25 Feb 2026
- ECO (Okeanis Eco) Bullish Pennant, detected on 25 Feb 2026
- KMDA (Kamada Ltd.) Bullish Pennant, detected on 25 Feb 2026
- FSM (Fortuna Mining) Bullish Pennant, detected on 24 Feb 2026
- RAIL (FreightCar America) Bullish Pennant, detected on 24 Feb 2026
Browse other patterns
Reversal
Candlestick
Momentum