
News › Reversal › Double Bottom
Stocks with Double Bottom Pattern
Live results from our daily pattern screener — most recent detection: 21 Oct 2026.
What is a double bottom pattern?
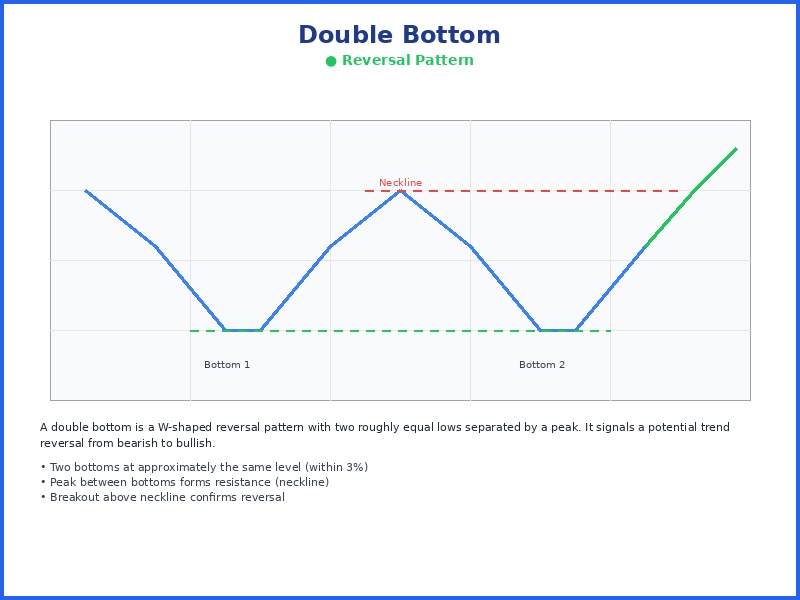
A double bottom is a reversal pattern in which price sets two distinct lows at roughly the same level, separated by an intervening peak, and confirms a shift from downtrend to uptrend once it breaks above that peak.
13 double bottom detections in the last 7 days, with projected win rates of 62-66%.
Total detections
17
Last week
13
Last month
17
Last 12 months
17
How reliable is the double bottom pattern?
In our most recent backtest (March – September 2026, out-of-sample), 67.9% of the 7,282 highest-scoring double bottom setups, out of 97,245 studied, were trading higher two weeks later. The projected win rate shown on each current detection is a conservative, calibrated estimate derived from that data; we publish the cautious figure rather than the raw historical rate. We score every detection on structure, volume, breakout strength, and risk/reward.
How do I find stocks forming a double bottom today?
Our screener scans more than 6,000 NYSE and NASDAQ stocks every trading day and flags new double bottom setups before the opening bell. Each detection in the list below shows its entry setup, price target, and stop-loss, most recently on 21 Oct 2026.
Learn more about the Double Bottom pattern →
How is a double bottom pattern different from an inverse head and shoulders pattern?
Both are bottoming reversals confirmed by a break above resistance, but a double bottom has two roughly equal lows, while an inverse head and shoulders has three troughs with a deeper middle low (the head). See inverse head and shoulders setups →
How is a double bottom pattern different from a rounding bottom pattern?
Both mark a turn from downtrend to uptrend, but a double bottom tests support in two distinct lows, while a rounding bottom forms a single smooth, gradual U-shaped curve. See rounding bottom setups →
Full Detection List
- USB (U.S. Bancorp.) Double Bottom, detected on 21 Oct 2026
- LOGI (Logitech International) Double Bottom, detected on 20 Oct 2026
- GSK (GSK Plc) Double Bottom, detected on 20 Oct 2026
- SITE (SiteOne Landscape) Double Bottom, detected on 19 Oct 2026
- VCYT (Veracyte Inc) Double Bottom, detected on 19 Oct 2026
- Z (Zillow Group) Double Bottom, detected on 16 Oct 2026
- BLK (BlackRock Finance) Double Bottom, detected on 16 Oct 2026
- MKL (Markel Group) Double Bottom, detected on 15 Oct 2026
- PEP (PepsiCo Inc) Double Bottom, detected on 15 Oct 2026
- SONY (Sony Group) Double Bottom, detected on 15 Oct 2026
- EVR (Evercore Inc) Double Bottom, detected on 14 Oct 2026
- APTV (Aptiv PLC) Double Bottom, detected on 14 Oct 2026
- APP (Applovin Corp) Double Bottom, detected on 14 Oct 2026
- NXT (Nextpower Inc) Double Bottom, detected on 13 Oct 2026
- MIR (Mirion Technologies) Double Bottom, detected on 13 Oct 2026
- CRNC (Cerence Inc) Double Bottom, detected on 9 Oct 2026
- MKSI (MKS Instruments) Double Bottom, detected on 6 Oct 2026
Browse other patterns
Continuation
Candlestick
Momentum