
Patterns › Momentum
Volatility Compression pattern
Volatility compression, a cousin of the Bollinger Band squeeze, is a momentum pattern in which a stock pauses in a base below a recent high while its daily price swings stop widening, with price holding near the top of the range before a possible breakout.
Stocks forming it recently ↓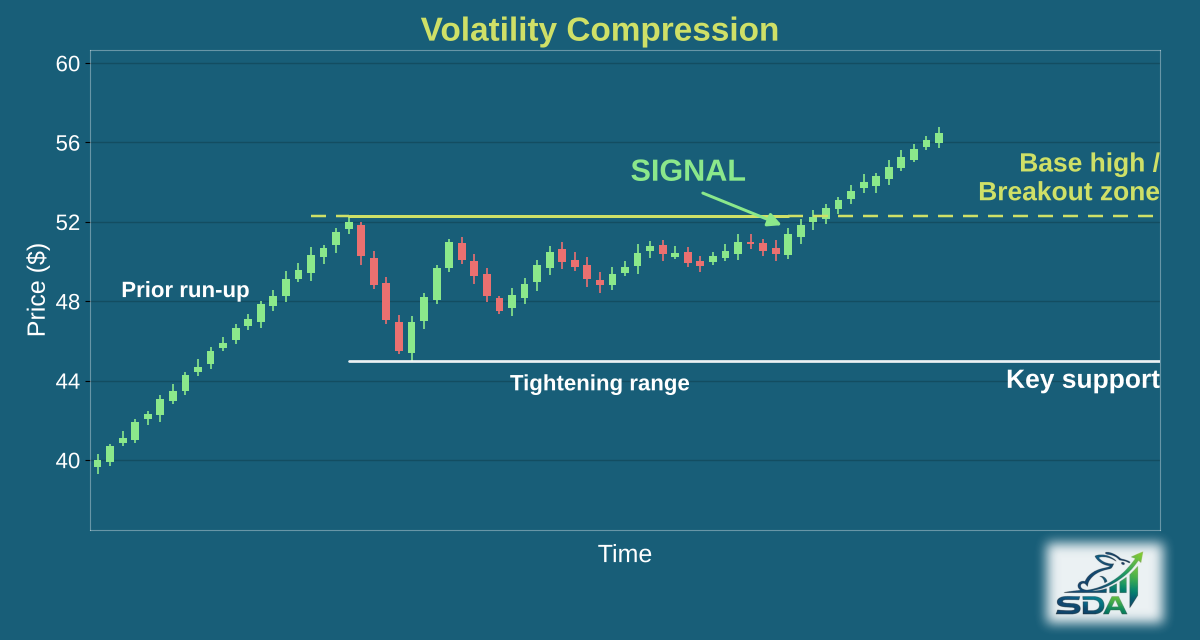
What does a volatility compression look like?
Our scanner checks it as a setup where all of these hold:
- A base 8 to 59 trading days long. It usually starts at the stock's highest point of the past 60 days; if that high is only days old, the base starts where price swings began to narrow.
- The base's high is 3% to 25% above its low.
- Daily price swings over the last week or so are no more than 15% wider than they were around the middle of the base. Our scanner doesn't require them to shrink.
- Price close to the top of the base: no more than one and a half average daily ranges below it.
- Price not in the bottom 30% of its Bollinger Bands, and not above the top band.
- Today's volume at least 70% of its 20-day average.
- A prior run-up isn't required.
How reliable is the volatility compression pattern?
In our most recent backtest (March – September 2026, out-of-sample), 68.2% of the 865 highest-scoring volatility compression setups, out of 19,388 studied, were trading higher two weeks later.
How are entry, stop and target set?
Every pick comes with an entry zone, price targets and a stop. The targets come from how far past volatility compression setups actually moved, not from a textbook projection of the pattern's height. The stop scales with the stock's own average daily range, so a volatile stock gets a wider stop than a quiet one.
How is it different from a flat base?
Both are bases near a recent high. Our volatility compression usually starts at the 60-day high and checks that daily price swings aren't widening, while our flat base looks at how tall the base is and how close price is to its 52-week high.
Stocks forming a volatility compression recently
All free volatility compression examples →
Free examples from our scans. Subscribers get every volatility compression setup, by 6 AM ET.
Other momentum patterns
Get every volatility compression setup before the open
Tickers, entry zones, targets and stops for every pattern we detect, in your inbox by 6 AM ET.
Start Free Trial →No credit card required · 14 days free