Introduction
Of the 16 bullish stock chart patterns we detect, one consistently delivers the highest market beat rate. The ascending triangle pattern — a classic technical analysis formation — showed an 81.6% market beat rate across 49 detections in a single week, outperforming every other pattern type in our algorithmic stock screening system.
At StockDataAnalytics, we've built a systematic pattern detection system that scans 6,000+ stocks daily across NASDAQ and NYSE. This is Part 4 of our pattern detection series. In Part 3, we covered Volatility Compression — our most frequently detected pattern. Now we're examining ascending triangles, a geometric chart pattern that, when properly validated through algorithmic screening, produces exceptional results for swing traders and position traders alike.
Unlike Volatility Compression's statistical approach to measuring range contraction, ascending triangle patterns are geometric — a flat horizontal resistance level meeting a rising support trendline. The pattern tells a clear story: sellers hold firm at one price, but buyers are becoming increasingly aggressive, willing to pay higher prices with each pullback. When detected systematically rather than by eye, these patterns reveal high-probability breakout setups that most retail traders miss entirely.
Important Disclosure: This is educational content about technical analysis methodology, not investment advice. We are not financial advisors. All trading involves substantial risk of loss. Consult a qualified financial professional before making investment decisions.
What Is an Ascending Triangle Pattern?
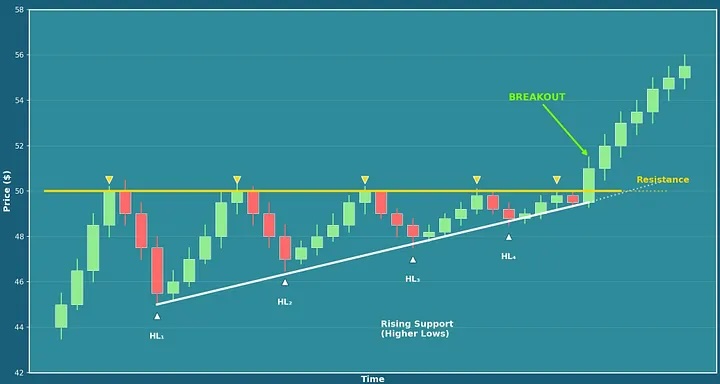
An ascending triangle forms when a stock's price repeatedly tests a horizontal resistance level while the lows gradually rise. Picture a ceiling that price keeps hitting, combined with a floor that keeps climbing. The space between them narrows until something has to give — and when it does, the resulting breakout often produces significant price movement.
Several characteristics define a well-formed ascending triangle as it develops. Price touches the same resistance level multiple times — at least two, ideally three or more distinct tests. Each pullback from resistance finds support at a higher level than the previous pullback, creating the signature "higher lows" pattern. The formation typically takes 3–12 weeks to develop fully. Volume often declines during formation as the pattern coils tighter, signaling quiet accumulation before a breakout.
Think of water building behind a dam. Each higher low represents water rising — more pressure building against the resistance. The dam holds — until it doesn't. When it breaks, the accumulated pressure releases all at once. Ascending triangles work the same way — buying pressure builds with each higher low until sellers at the resistance level are overwhelmed and the stock breaks out.
Retail traders typically miss ascending triangle setups for several reasons. The multiple tests of resistance look like failure — "it tried to break out and couldn't." The rising support trendline isn't obvious without drawing trendlines or using pattern recognition software. By the time resistance finally breaks convincingly, the initial move has already happened. Most critically, traders lack the patience to wait through weeks of consolidation, entering too early on false breakouts or giving up entirely. This is precisely why algorithmic pattern detection provides an edge — it systematically identifies these formations across thousands of stocks without the emotional biases that plague manual chart reading.
Why Ascending Triangle Patterns Have a Statistical Edge
In the week of 10 Nov 2025, our stock screening system flagged 49 ascending triangle patterns. 81.6% outperformed the S&P 500 over the subsequent week. That's not random chance — that's a structural edge built into how markets process supply and demand.
Our subscribers receive these pattern-based stock recommendations before the market open each day. Learn more about our detection system or sign up for early access.
This bullish chart pattern has an edge for three fundamental reasons, each supported by both market microstructure theory and our empirical backtesting data.
Supply Exhaustion at Resistance
Each time price tests resistance and pulls back, some sellers are satisfied — they got their price and exited. With each successive test, fewer shares remain for sale at that level. Meanwhile, buyers are demonstrating increasing conviction by paying higher prices on each pullback. The flat resistance line masks an increasingly one-sided battle. Eventually, sellers at that level are simply exhausted, and the breakout occurs with minimal overhead supply.
Institutional Accumulation During Triangle Formation
Large institutions often accumulate positions during ascending triangle formations. The repeated tests of resistance provide natural selling opportunities that institutions can absorb without significantly moving price. Each higher low represents institutions buying another tranche — they're systematic buyers on pullbacks. When they've built their full position and resistance finally breaks, they let it run. This institutional footprint is detectable through volume analysis, which is why volume confirmation is weighted so heavily in our scoring algorithm.
Measured Move Price Target Reliability
Ascending triangles offer a built-in price target: the height of the triangle projected upward from the breakout point. This "measured move" technique has statistical validity because it represents the accumulated demand that built during the pattern formation. Traders and algorithms alike use this projection, creating a self-reinforcing element to the target. For swing traders setting profit targets, this measured move calculation provides a data-driven exit strategy rather than guesswork.
How Our Algorithm Identifies Ascending Triangle Breakouts: The Three-Dimensional Scoring System
At StockDataAnalytics, every detected pattern gets scored across three dimensions: Structure (35%), Volume (35%), and Breakout Readiness (30%). Each dimension contains multiple factors, weighted based on what actually predicts successful breakouts in our backtesting data across thousands of historical patterns.
A perfect score is 100. We typically only recommend patterns scoring 65 or higher. But not all high-scoring patterns are ready to trade immediately: the Breakout Readiness dimension specifically addresses timing, helping traders distinguish between patterns still forming and those primed for imminent breakout.
Dimension 1: Structure Score (35% of Total)
Structure measures the geometric quality of the ascending triangle itself. Is resistance clearly defined? Is the rising support trendline statistically valid? Does the pattern show proper convergence toward a breakout point?
Resistance Level Validation Through Multiple Touches
Horizontal resistance needs validation through multiple price tests. A level touched once could be random noise; a level touched three or four times is a confirmed supply zone. We count distinct touches — price reaching the resistance zone and pulling back — with minimum spacing between touches to avoid counting the same test twice.
The scoring ranges from zero points (fewer than two clear touches) to four points (four or more well-spaced touches). More touches confirm the resistance level is genuine. Institutions are trading there repeatedly. When that supply finally exhausts, the breakout carries more significance and tends to produce larger price moves.
Rising Support Trendline Quality (R-Squared Analysis)
The rising support line should reflect a consistent, linear upward trend in the higher lows — not erratic jumps or scattered price points. To measure trendline quality, we calculate R-squared on two variables: time (when each swing low occurred) and price (the value of each swing low). R-squared tells us how well these lows fit a straight line. A value of 1.0 means the higher lows fall perfectly along a linear trendline; a value near 0 indicates no discernible linear relationship. The closer to 1.0, the more consistently buyers are stepping in at progressively higher prices — a hallmark of genuine accumulation.
Scores range from one point (R-squared of 0.7 — acceptable fit) to four points (R-squared above 0.9 — excellent fit). A clean trendline indicates consistent, reliable buying behavior. Choppy, irregular higher lows suggest less reliable demand and lower probability of a successful breakout.
Pattern Duration Assessment
Ascending triangles need time to develop properly. Too short and there's insufficient accumulation to fuel a meaningful breakout. Too long and the pattern may go stale as market conditions shift. Scores range from zero to two points based on duration, with optimal formation time between 4–8 weeks. Patterns under 3 weeks or over 12 weeks score lower, reflecting the diminished reliability at both extremes.
Trendline Convergence Measurement
As the ascending triangle matures, the distance between resistance and rising support should narrow — this convergence is what creates the "coiled spring" effect that precedes powerful breakouts. We compare the price range in the first third of the pattern to the last third. Scores range from zero to two points, with convergence above 40% (the last third's range is 60% or less of the first third's range) scoring highest.
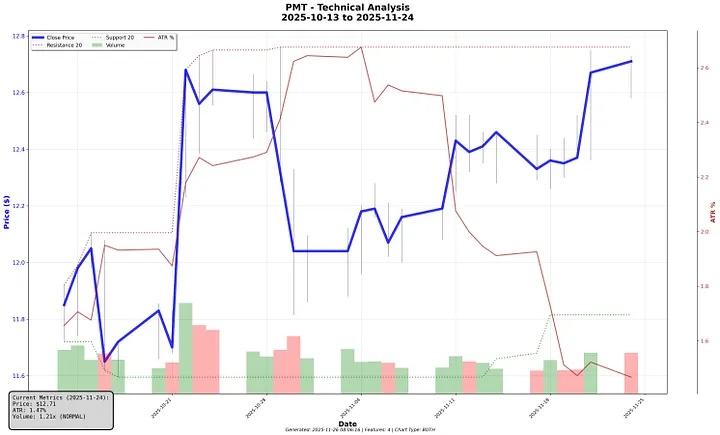
Stock Example: PennyMac Mortgage Investment Trust (PMT)
PMT illustrates textbook ascending triangle geometry. Following a move higher in late October, the stock established flat resistance near $12.70 with multiple tests through early November. Meanwhile, the rising support trendline connected a series of higher lows climbing from $11.60 toward $11.85 — each pullback finding buyers at progressively higher prices. As the pattern matured, the converging trendlines created visible compression, with price action narrowing toward the apex. The breakout on November 25th pushed price to $12.71 on 1.21x average volume, clearing resistance as the triangle resolved to the upside.
Dimension 2: Volume Confirmation Score (35% of Total)
Volume confirms whether the geometric pattern has real substance behind it. Price patterns without volume confirmation are just lines on a chart — they tell you nothing about whether institutional money is actually participating. Volume analysis shows whether real capital is flowing into the stock, which is the difference between a pattern that breaks out and one that fizzles.
For ascending triangle patterns specifically, our algorithm looks for a signature volume profile: declining volume during formation (accumulation happening quietly) followed by a surge on breakout (conviction revealed). This volume signature is one of the strongest predictors of breakout success in our backtesting data.
Volume Decline During Pattern Formation
During healthy triangle formation, average daily volume should decrease from the stock's normal baseline. This declining volume indicates quiet accumulation rather than distribution — large players building positions methodically without attracting attention or moving prices.
Scores range from one point (minimal decline) to four points (volume decline exceeding 25% from average). If a stock normally trades 500,000 shares daily but averages 350,000 during triangle formation, that 30% decline signals institutional accumulation. If volume stays at 480,000, there's minimal compression — less conviction in the pattern and lower probability of a meaningful breakout.
Breakout Volume Ratio
When price breaks above resistance, volume should surge. This is the most heavily weighted volume factor in our entire scoring system because breakout volume is the single strongest confirmation of institutional participation.
Scores range from one point (volume near average) to six points (volume exceeding 2.5x average). A breakout on light volume often fails — it lacks the buying conviction to sustain the move. A breakout on 2x or greater volume indicates real institutional buyers stepping in, not just retail traders chasing momentum. In our data, high-volume breakouts from ascending triangles produce significantly larger average gains than low-volume breakouts.
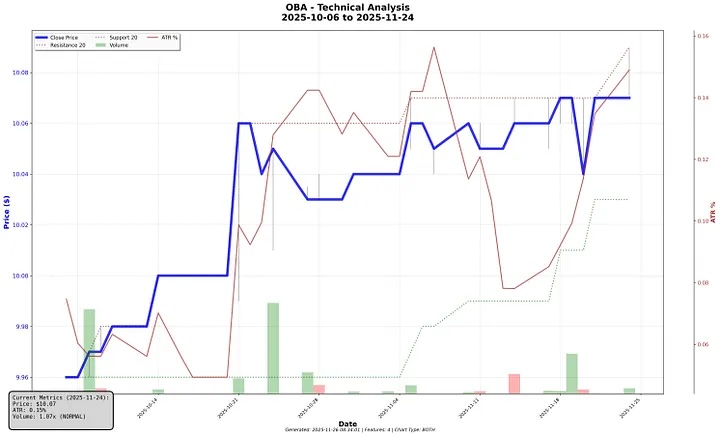
Stock Example: Oxley Bridge Acquisition Limited (OBA)
OBA demonstrates the classic volume signature our algorithm seeks in a well-formed ascending triangle. Volume spiked early in the pattern formation (mid-October) as price initially tested resistance near $10.06, then steadily declined through late October and November as the stock consolidated between rising support around $9.97–$10.03 and flat resistance at $10.06–$10.07. The volume bars visibly contract during the consolidation phase — the telltale "coiled spring" effect indicating supply absorption and accumulating buying pressure at progressively higher lows. The declining ATR% line (dropping from ~0.14% to ~0.08% during formation) confirms volatility compression as the triangle tightened. Current volume registered at 1.07x average (NORMAL), with price poised at resistance awaiting breakout confirmation.
Dimension 3: Breakout Readiness Score (30% of Total)
Structure tells us the ascending triangle is geometrically valid. Volume confirms accumulation is occurring. But when will it break out? Breakout Readiness measures whether the pattern is actionable NOW or needs more time to develop — a critical distinction for traders looking to time their entries.
Breakout Distance Above Resistance (ATR-Normalized)
Has price actually broken through resistance, or is it just testing again? We measure breakout distance in ATR (Average True Range) units to normalize across stocks with vastly different volatilities and price levels.
Scores range from zero points (price still below resistance) to six points (price 0.5+ ATR above resistance). A $2 move means different things for different stocks. For a volatile biotech, $2 might be 0.3 ATR — barely a tremor. For a stable utility stock, $2 might be 1.5 ATR — a significant breakout that likely represents genuine institutional buying. ATR normalization ensures our algorithm compares breakout quality on an apples-to-apples basis across the entire stock universe.
False Breakout Detection and Analysis
Has the pattern already attempted a breakout and failed? Failed breakouts are one of the most common traps in technical analysis, and detecting them is critical for avoiding low-probability setups. We examine the late stages of the pattern (final 20% of duration) for instances where price exceeded resistance but closed back below — the classic "bull trap" that depletes buying energy.
Scores range from zero points (multiple failed breakouts — pattern may be exhausted) to four points (zero or one failed attempt — a fresh, untested breakout). Each failed breakout attempt depletes buying pressure and traps early buyers. Patterns with three or more failures often lack the energy to break out successfully. Our algorithm penalizes these exhausted setups, steering recommendations toward fresh patterns with pent-up breakout potential.
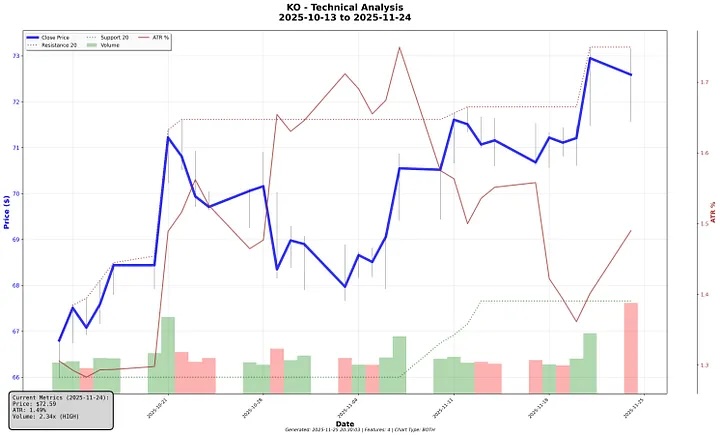
Stock Example: The Coca-Cola Company (KO)
KO demonstrates the breakout quality characteristics our algorithm prioritizes. Price broke cleanly above the $71.60 resistance level, clearing it by over 1.3 ATR to reach $72.95. This was the pattern's first serious breakout attempt — no prior false breakouts to deplete momentum or trap early buyers. Volume confirmed the move at 1.68x average, signaling institutional conviction behind the breakout. The combination of clean breakout distance, no prior failures, and strong volume produced a high Breakout Readiness score.
How We're Improving Our Ascending Triangle Detection Algorithm
Our scoring system has been refined through analysis of thousands of pattern outcomes, but we recognize there's always room for improvement. Pattern detection algorithms must constantly evolve as markets change and as we gather more outcome data. Here's where we're focusing our development efforts.
Stricter Horizontal Resistance Validation
The current detector accepts resistance lines with noticeable upward slopes, resulting in ascending channels occasionally being misclassified as ascending triangles. A textbook ascending triangle requires a truly horizontal resistance level where price repeatedly fails at the same price ceiling. Tightening the flatness requirement will filter out patterns where resistance is creeping higher — an important distinction because ascending channels and ascending triangles have meaningfully different breakout characteristics.
Discrete Higher Lows vs. Positive Slope Detection
The detector currently fits a trendline to the lows and checks for a positive slope. However, this approach accepts patterns where lows hover at roughly the same level — mathematically positive but not visually ascending. A more robust approach will identify distinct swing lows and confirm each successive low is meaningfully higher than the previous one, creating the visible "stair-step" higher lows pattern that experienced technical analysts recognize as genuine accumulation.
Gap-Created Pattern Filtering
Consolidations that form after large price gaps score well algorithmically because they mathematically fit the ascending triangle criteria, but these aren't organic accumulation patterns. When a stock gaps up and then consolidates, buyers aren't gradually pushing lows higher against resistance — the structure is artificially created by the gap. We're developing detection for significant gaps within the pattern formation window to either penalize or separately classify these formations, improving signal quality.
Mid-Pattern Violation Detection
Several high-scoring patterns in our analysis showed mid-pattern washouts where price broke well below the rising support line before recovering. The current detector averages out these violations when fitting trendlines. A more rigorous approach will identify when price significantly violates the support trendline and either restart pattern detection from after the violation or apply a score penalty — because a broken and recovered trendline carries different probabilistic weight than an intact one.
Touch Quality Scoring Enhancement
Patterns currently score well even when price doesn't cleanly interact with support and resistance. The best ascending triangle patterns show clear, visible reversals at resistance — price approaches the ceiling, gets rejected, and moves lower. Similarly, support touches should show price finding buyers and bouncing at progressively higher levels. Rewarding patterns with clean, identifiable touches at both resistance and support will prioritize the highest-quality setups that produce the most reliable breakouts.
We're committed to continuous improvement and share our methodology openly with subscribers. Start your free trial here to evaluate the signals our system generates with your own analysis. We welcome subscriber feedback and actively incorporate it into our development roadmap.
Risk Warning
Pattern-based stock trading involves substantial risk of loss. Past performance does not guarantee future results. The statistics and examples in this article describe historical system performance, not predictions of future outcomes. Market conditions change. Patterns fail. Individual results will vary significantly.
The scoring system described here evaluates ascending triangle pattern quality based on historical data. High-scoring patterns can and do fail. Low-scoring patterns occasionally work. Use algorithmic pattern detection as one input among many in your investment research, not as a complete trading system.
Ascending triangle patterns, like all technical analysis chart patterns, represent probabilities, not certainties. A pattern with an 80% market beat rate means 20% of the time it underperforms. Position sizing, risk management, and stop losses are critical components of any systematic trading approach.
Educational Content Disclaimer
This article explains technical analysis methodology and describes how our stock pattern detection algorithm works. Nothing here constitutes investment advice or recommendations to buy or sell securities. We are not registered investment advisors or financial planners.
The discussions about position sizing, stop losses, and risk management describe how these elements work in pattern-based swing trading based on technical analysis literature and common practices. These are educational descriptions, not guidance on what you personally should do. Consult a qualified financial professional who understands your complete financial situation before making investment decisions.