
Patterns › Continuation
Bull Flag pattern
A bull flag is a continuation pattern that forms after a sharp price advance (the flagpole), when the stock pauses (the flag) before it may resume the uptrend.
Stocks forming it now ↓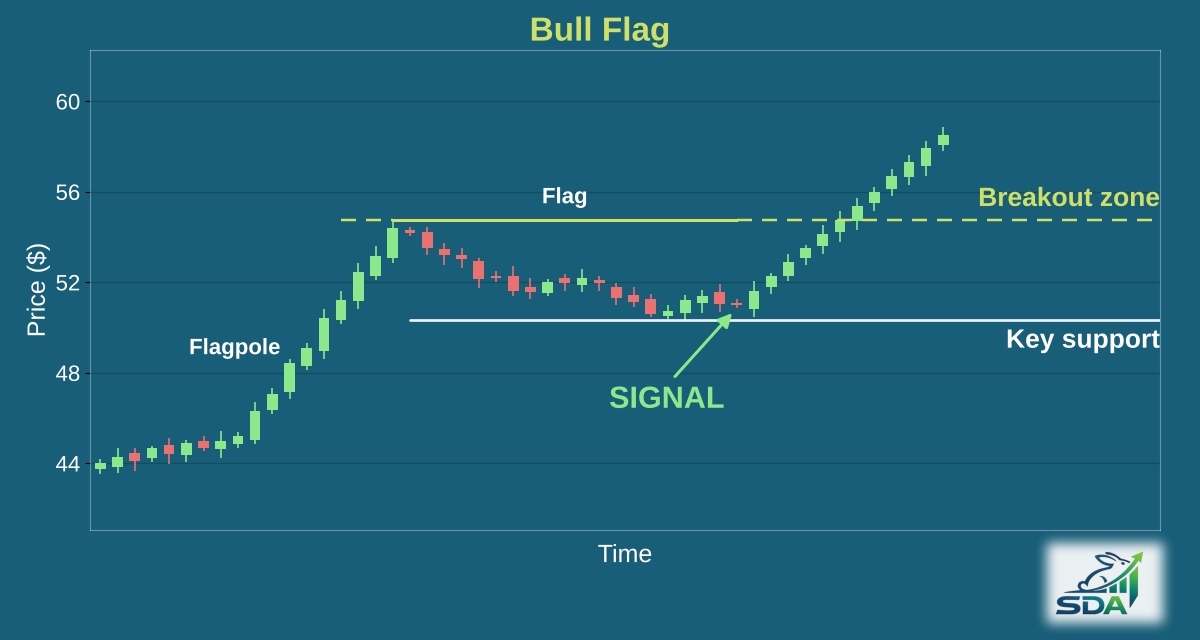
What does a bull flag look like?
Our scanner checks it as a setup where all of these hold:
- A flagpole: a rise of at least 5% over 2 to 35 trading days.
- A flag that runs from the top of the pole to today, at least 4 trading days long. The pole and flag together fit inside the last 60 trading days.
- The flag hasn't given back the whole pole.
- The flag's direction isn't checked. A flat, rising or falling pause all count, not only the textbook down-sloping channel.
- Volume isn't checked.
- Where price sits now isn't checked either. It can still be inside the flag or already above the top of the pole; a breakout isn't required.
How reliable is the bull flag pattern?
In our most recent backtest (January – July 2026, out-of-sample), 61.7% of the 392 highest-scoring bull flag setups, out of 127,484 studied, were trading higher two weeks later.
How are entry, stop and target set?
Every pick comes with an entry zone, price targets and a stop. The targets come from how far past bull flag setups actually moved, not from a textbook projection of the pattern's height. The stop scales with the stock's own average daily range, so a volatile stock gets a wider stop than a quiet one.
How is it different from a bullish pennant?
Both pause after a sharp rally. Our bullish pennant needs a sharper pole, at least 6% in four days, and a pause that narrows by at least 30%, while our bull flag accepts a pause of any shape.
Stocks forming a bull flag now
Free examples from our scans. Subscribers get every bull flag setup, 6 in the latest scan, by 6 AM ET.
Other continuation patterns
Get every bull flag setup before the open
Tickers, entry zones, targets and stops for every pattern we detect, in your inbox by 6 AM ET.
Start Free Trial →No credit card required · 14 days free