
Patterns › Continuation
Symmetrical Triangle pattern
A symmetrical triangle is a consolidation pattern formed by lower highs and higher lows converging toward an apex; in an uptrend it typically resolves to the upside on an expansion in volume.
Stocks forming it now ↓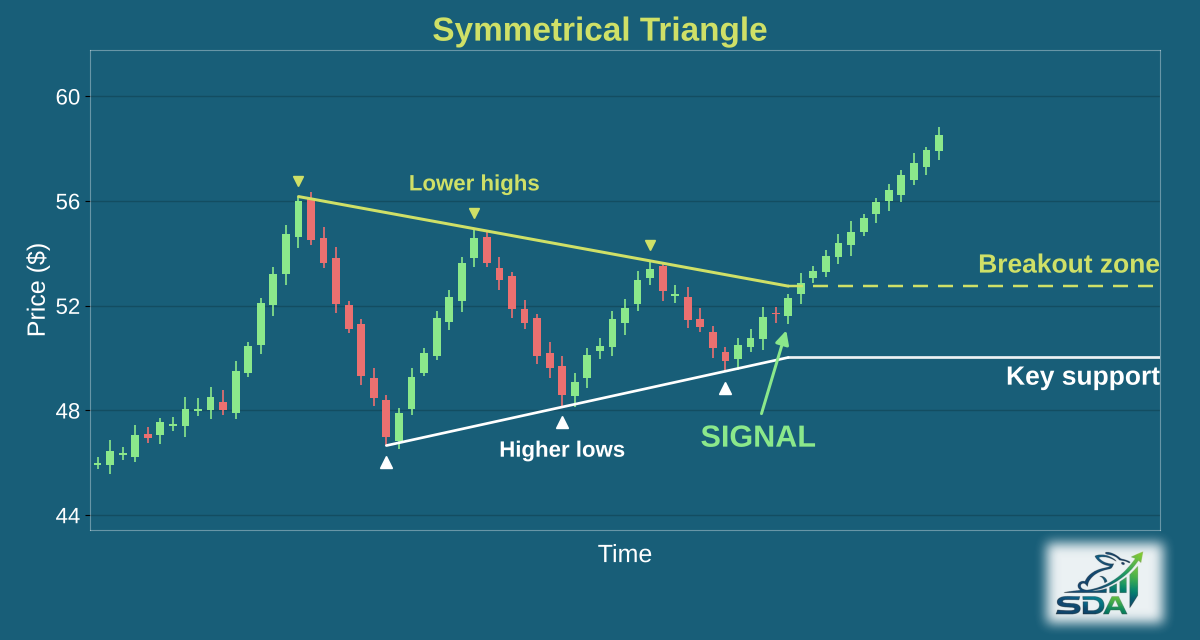
What does a symmetrical triangle look like?
Our scanner checks it as a setup where all of these hold:
- A pattern 12 to 60 trading days long.
- At least two lower highs along a falling resistance line, and at least two higher lows along a rising support line.
- The two lines narrow the range by at least 10%.
- The slopes don't have to match. One line can be up to four times steeper than the other.
- Price within 7% of the upper line, or already above it.
- Our scanner treats every symmetrical triangle as a bullish setup. A prior trend and volume aren't checked.
How reliable is the symmetrical triangle pattern?
In our most recent backtest (March – September 2026, out-of-sample), 69.0% of the 554 highest-scoring symmetrical triangle setups, out of 19,321 studied, were trading higher two weeks later.
In our analysis of 39,037 symmetrical triangle trades, low-scoring setups were close to a coin flip, and win rates climbed mainly above a score of 35.
What makes a symmetrical triangle fail?
- A deep drop on the first day. The further price fell intraday on day one, the lower the win rate.
- A weak first-day close, in the bottom fifth of the day's range.
- A failed throwback, or no advance at all. Trades that never moved up almost always lost.
- A large gap down at the open, more than 5%.
- A short, shallow triangle.
- A strong, high-confidence bull market, where even mid-scoring setups barely broke even.
How are entry, stop and target set?
Every pick comes with an entry zone, price targets and a stop. The targets come from how far past symmetrical triangle setups actually moved, not from a textbook projection of the pattern's height. The stop scales with the stock's own average daily range, so a volatile stock gets a wider stop than a quiet one.
How is it different from a bullish pennant?
Both contract between converging trendlines, but a symmetrical triangle builds over a longer base, while a bullish pennant is a brief consolidation immediately after a sharp advance.
Stocks forming a symmetrical triangle now
All free symmetrical triangle examples →
Free examples from our scans. Subscribers get every symmetrical triangle setup, 1 in the latest scan, by 6 AM ET.
Other continuation patterns
Get every symmetrical triangle setup before the open
Tickers, entry zones, targets and stops for every pattern we detect, in your inbox by 6 AM ET.
Start Free Trial →No credit card required · 14 days free