
Patterns › Continuation
Ascending Triangle pattern
An ascending triangle is a continuation pattern defined by flat horizontal resistance and a rising trendline of higher lows, reflecting buyers who repeatedly step in at higher prices until the stock breaks out above resistance.
Stocks forming it now ↓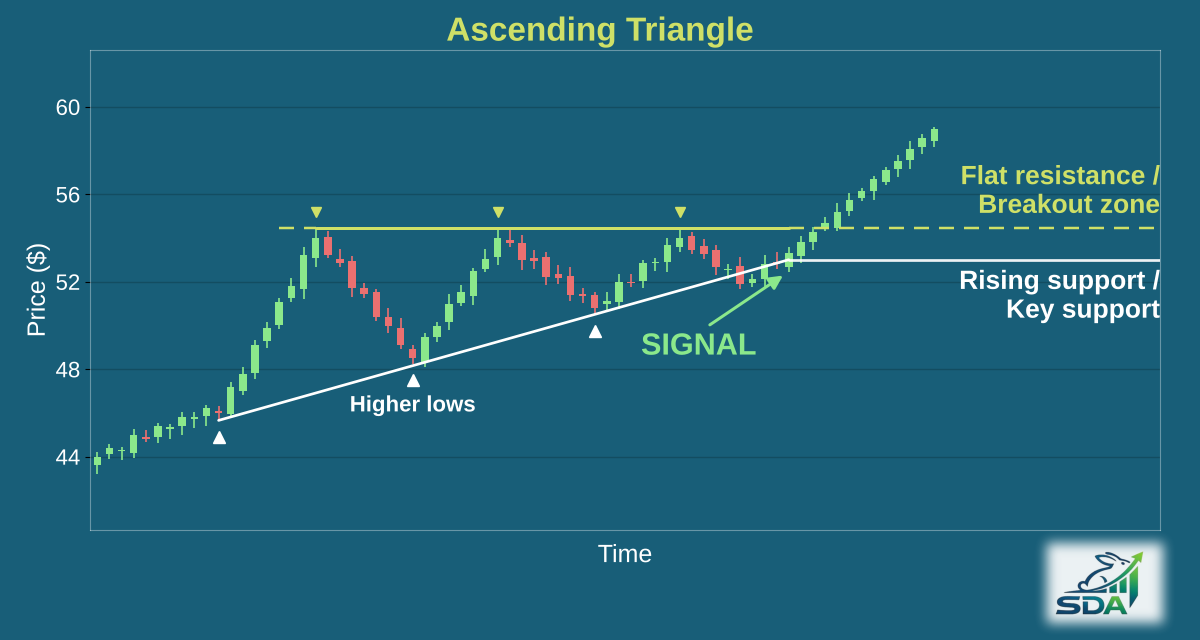
What does an ascending triangle look like?
Our scanner checks it as a setup where all of these hold:
- A pattern 15 to 60 trading days long.
- A flat ceiling formed by the highest highs, touched at least once.
- At least two swing lows along a rising support line, each no more than 1% below the one before.
- The trading range doesn't widen by more than about 10% from the start of the pattern to the end. It doesn't have to narrow.
- Price within 10% of the ceiling, or already above it.
- A prior uptrend and volume aren't checked.
How reliable is the ascending triangle pattern?
In our most recent backtest (March – September 2026, out-of-sample), 63.4% of the 14,711 highest-scoring ascending triangle setups, out of 119,148 studied, were trading higher two weeks later.
How are entry, stop and target set?
Every pick comes with an entry zone, price targets and a stop. The targets come from how far past ascending triangle setups actually moved, not from a textbook projection of the pattern's height. The stop scales with the stock's own average daily range, so a volatile stock gets a wider stop than a quiet one.
How is it different from a symmetrical triangle?
Both narrow toward an apex, but an ascending triangle has a flat ceiling with rising lows beneath it, while a symmetrical triangle has falling highs as well as rising lows.
Stocks forming an ascending triangle now
All free ascending triangle examples →
Free examples from our scans. Subscribers get every ascending triangle setup, 4 in the latest scan, by 6 AM ET.
Other continuation patterns
Get every ascending triangle setup before the open
Tickers, entry zones, targets and stops for every pattern we detect, in your inbox by 6 AM ET.
Start Free Trial →No credit card required · 14 days free