
Patterns › Reversal
Rounding Bottom pattern
A rounding bottom, also called a saucer bottom, is a reversal pattern in which price traces a smooth U-shaped curve over many months as selling gradually gives way to buying.
Stocks forming it recently ↓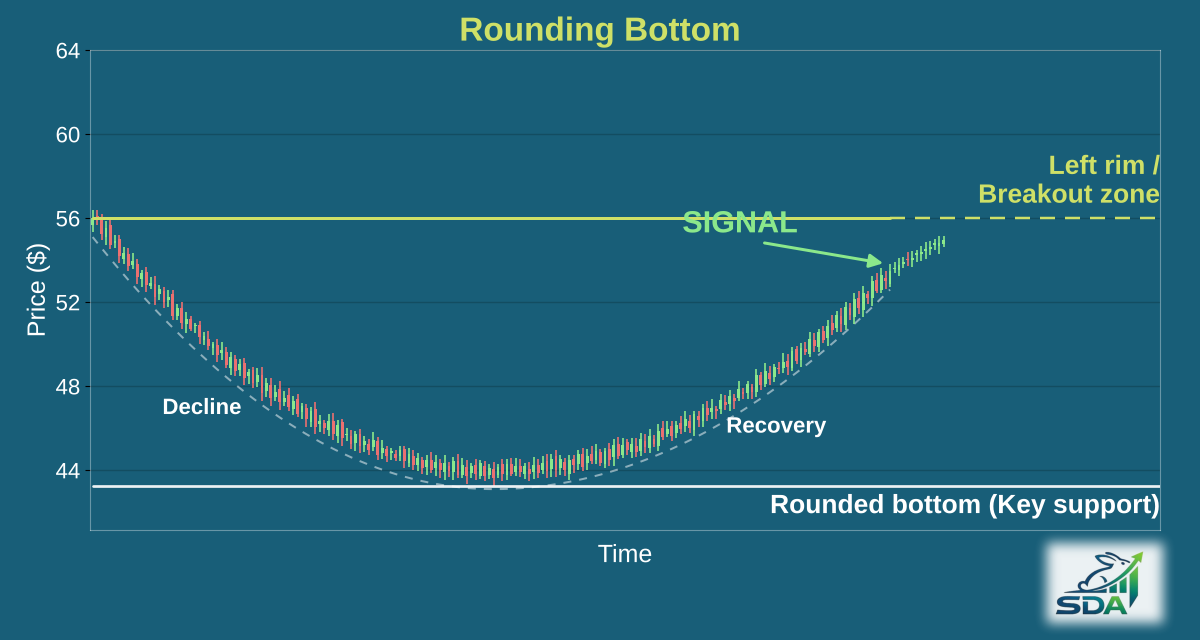
What does a rounding bottom look like?
Our scanner checks it as a setup where all of these hold:
- The last 180 trading days, about eight and a half months, fit a U-shaped curve reasonably well.
- The lowest point sits in the middle half of that window, at least 30 trading days from either end.
- Depth, the size of the recovery and the distance to the rim aren't checked.
- The left rim we mark is simply the closing price 180 trading days ago.
- Volume isn't checked.
How reliable is the rounding bottom pattern?
In our most recent backtest (March – September 2026, out-of-sample), 64.1% of the 6,445 highest-scoring rounding bottom setups, out of 80,985 studied, were trading higher two weeks later.
How are entry, stop and target set?
Every pick comes with an entry zone, price targets and a stop. The targets come from how far past rounding bottom setups actually moved, not from a textbook projection of the pattern's height. The stop scales with the stock's own average daily range, so a volatile stock gets a wider stop than a quiet one.
How is it different from a cup and handle?
Both trace a rounded, U-shaped base, but a rounding bottom breaks out straight from the curve, while a cup and handle first pauses in a short pullback (the handle).
Stocks forming a rounding bottom recently
All free rounding bottom examples →
Free examples from our scans. Subscribers get every rounding bottom setup, by 6 AM ET.
Other reversal patterns
Get every rounding bottom setup before the open
Tickers, entry zones, targets and stops for every pattern we detect, in your inbox by 6 AM ET.
Start Free Trial →No credit card required · 14 days free