
Patterns › Reversal
Inverse Head and Shoulders pattern
An inverse head and shoulders is a reversal pattern of three troughs — a lower middle trough (the head) flanked by two shallower troughs (the shoulders) — that signals a shift from downtrend to uptrend once price breaks above the neckline.
Stocks forming it recently ↓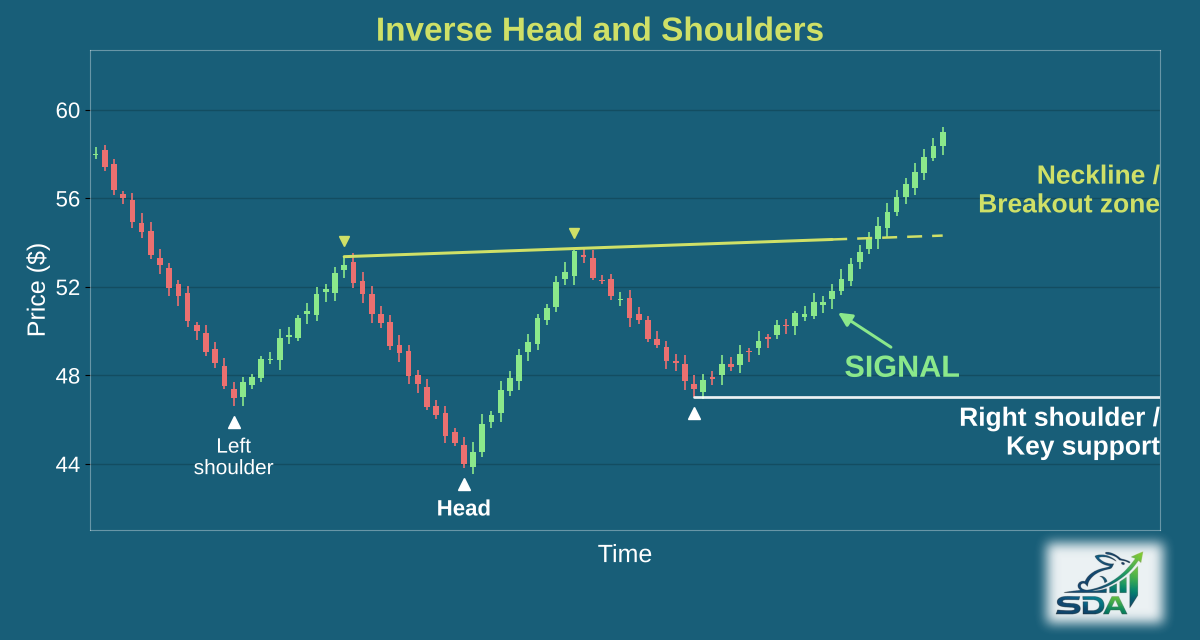
What does an inverse head and shoulders look like?
Our scanner checks it as a setup where all of these hold:
- Three troughs within roughly the last 150 trading days: a left shoulder, a lower head, and a right shoulder.
- The head sits at least 3% below the right shoulder.
- The two shoulders bottom out within 15% of each other. They don't need to match.
- A neckline drawn through the highest points between the troughs. It can slope up or down.
- A recent right shoulder: formed within the last 30 trading days, with price no more than 8% below the neckline. Price can already be above it.
- A prior downtrend and volume aren't checked.
How reliable is the inverse head and shoulders pattern?
In our most recent backtest (March – September 2026, out-of-sample), 64.5% of the 456 highest-scoring inverse head and shoulders setups, out of 32,450 studied, were trading higher two weeks later.
Reliability depends heavily on the setup. In our analysis of 67,041 detections, the lowest-scoring patterns were barely better than a coin flip, while the highest-scoring ones did far better.
What makes an inverse head and shoulders fail?
- Price falls back to retest the neckline after breaking out (a throwback). Setups with a throwback succeeded far less often than those without.
- The stock gaps up on the day after the signal. Gap-ups, especially above 2%, skewed toward losers.
- The market is already in a strong uptrend. The pattern underperformed in high-confidence bull regimes.
- A shallow right shoulder. Deeper right shoulders did better, the opposite of the textbook warning.
From our analysis of past inverse head and shoulders setups.
How are entry, stop and target set?
Every pick comes with an entry zone, price targets and a stop. The targets come from how far past inverse head and shoulders setups actually moved, not from a textbook projection of the pattern's height. The stop scales with the stock's own average daily range, so a volatile stock gets a wider stop than a quiet one.
How is it different from a double bottom?
A double bottom has two troughs at about the same level. An inverse head and shoulders has three, with the middle one the lowest, and its neckline joins the peaks between them rather than a single peak.
Stocks forming an inverse head and shoulders recently
All free inverse head and shoulders examples →
Free examples from our scans. Subscribers get every inverse head and shoulders setup, by 6 AM ET.
Other reversal patterns
Get every inverse head and shoulders setup before the open
Tickers, entry zones, targets and stops for every pattern we detect, in your inbox by 6 AM ET.
Start Free Trial →No credit card required · 14 days free