
Patterns › Reversal
Post-Collapse Recovery pattern
A post-collapse recovery is a reversal pattern in which a stock that has fallen 35% or more from its high of the past year rebounds, winning back at least 30% of the drop, and holds near the rebound high, signaling a potential turn from a deep downtrend.
Stocks forming it recently ↓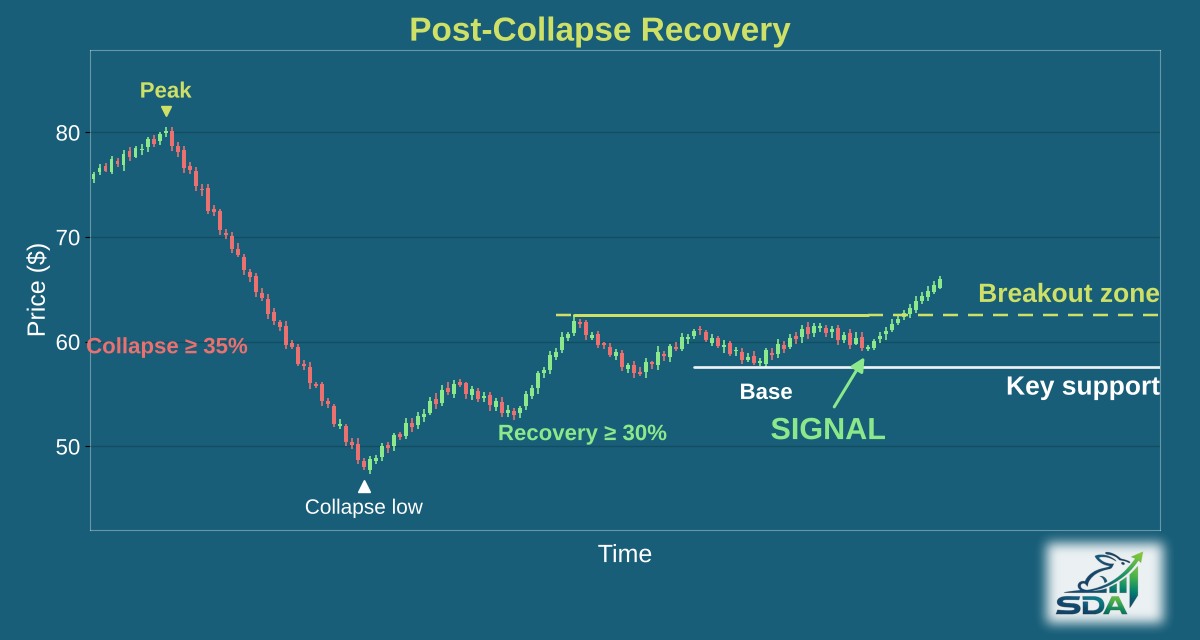
What does a post-collapse recovery look like?
Our scanner checks it as a setup where all of these hold:
- A fall of at least 35% from the stock's high of the past year, with the low 8 to 120 trading days ago.
- A rebound that has won back at least 30% of the drop.
- Price no more than 18% below the rebound high.
- A breakout isn't required, and it can also flag the stock on the day it makes a new rebound high.
- Volume isn't required.
How reliable is the post-collapse recovery pattern?
In our most recent backtest (March – September 2026, out-of-sample), 69.8% of the 757 highest-scoring post-collapse recovery setups, out of 21,831 studied, were trading higher two weeks later.
How are entry, stop and target set?
Every pick comes with an entry zone, price targets and a stop. The targets come from how far past post-collapse recovery setups actually moved, not from a textbook projection of the pattern's height. The stop scales with the stock's own average daily range, so a volatile stock gets a wider stop than a quiet one.
How is it different from a rounding bottom?
Both are bottoming patterns, but a post-collapse recovery starts with a fall of at least 35% and a sharp rebound, then pauses below the rebound high, while a rounding bottom is a slow, smooth U-shape.
Stocks forming a post-collapse recovery recently
All free post-collapse recovery examples →
Free examples from our scans. Subscribers get every post-collapse recovery setup, by 6 AM ET.
Other reversal patterns
Get every post-collapse recovery setup before the open
Tickers, entry zones, targets and stops for every pattern we detect, in your inbox by 6 AM ET.
Start Free Trial →No credit card required · 14 days free