
Patterns › Reversal
Double Bottom pattern
A double bottom is a reversal pattern in which price sets two distinct lows at roughly the same level, separated by an intervening peak, and confirms a shift from downtrend to uptrend once it breaks above that peak.
Stocks forming it now ↓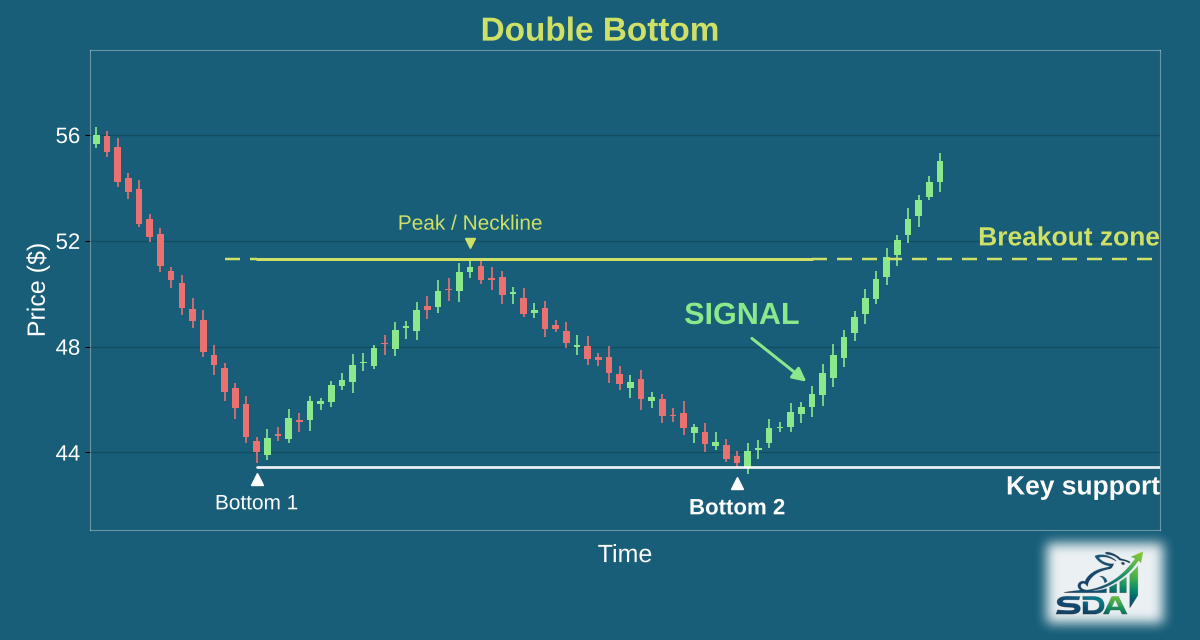
What does a double bottom look like?
Our scanner checks it as a setup where all of these hold:
- Two swing lows 20 to 60 trading days apart, the second one 5 to 10 trading days ago.
- The two lows at about the same level: within four average daily ranges of each other.
- A peak between them at least two average daily ranges above the lower of the two lows. That peak is the neckline.
- Price at least 2% above the second low and no more than 10% above the neckline.
- A prior downtrend and volume aren't checked.
How reliable is the double bottom pattern?
In our most recent backtest (March – September 2026, out-of-sample), 67.9% of the 7,282 highest-scoring double bottom setups, out of 97,245 studied, were trading higher two weeks later.
In our analysis of 157,787 double bottom trades, the score helped most when the market was mildly bullish and added nothing in a moderately bearish market.
What makes a double bottom fail?
- A weak first day, closing in the bottom fifth of its range.
- A gap up that trades back below the prior close. Gap-ups whose first-day low held above it did much better.
- A failed throwback, or no advance at all. Trades that never moved up almost always lost.
- Lagging the market over the ten days before the signal.
- Volume drying up through the base, the opposite of the textbook rule.
- A neckline far below the 52-week high, 27% or more.
From our analysis of past double bottom setups.
How are entry, stop and target set?
Every pick comes with an entry zone, price targets and a stop. The targets come from how far past double bottom setups actually moved, not from a textbook projection of the pattern's height. The stop scales with the stock's own average daily range, so a volatile stock gets a wider stop than a quiet one.
How is it different from an inverse head and shoulders?
Both are bottoming reversals confirmed by a break above resistance, but a double bottom has two roughly equal lows, while an inverse head and shoulders has three troughs with a deeper middle low (the head).
Stocks forming a double bottom now
All free double bottom examples →
Free examples from our scans. Subscribers get every double bottom setup, 14 in the latest scan, by 6 AM ET.
Other reversal patterns
Get every double bottom setup before the open
Tickers, entry zones, targets and stops for every pattern we detect, in your inbox by 6 AM ET.
Start Free Trial →No credit card required · 14 days free