
The reversal pattern most traders learn first is a coin flip, and its best-known volume rule runs backwards
TL;DR: Across 157,787 double bottom trades on NYSE and NASDAQ stocks (January 1 to September 30, 2026), the pattern won 50.4% of the time unfiltered and beat the market 46.9% of the time. Setups scoring 34 or higher on our quality model won 56.8% of 5,936 trades. Two textbook rules failed. Bases where volume dried up were the weakest volume group (47.2%, against 52.6% for steady volume), and waiting for the close above the neckline added nothing on average.
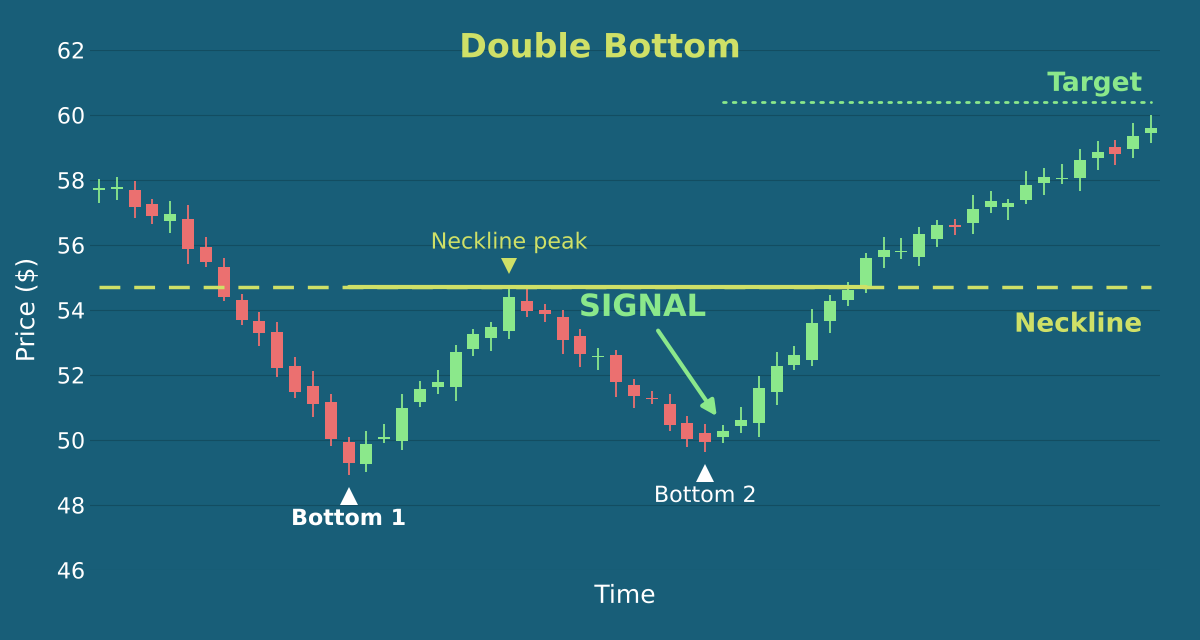
The double bottom is simple to spot. A stock falls to a low, rallies, falls back to roughly the same level, and turns up again. The high of the rally between the two lows is the neckline; a close above it is the classic buy signal.
Thomas Bulkowski's page on the Eve & Eve double bottom carries the two rules most traders follow. Volume is "usually higher on the left bottom," and "a downward volume trend suggests good post breakout performance." The pattern "confirms as a true double bottom once price closes above the peak between the two valleys"; if you don't wait, he puts the chance that price keeps falling at 48%. His 12% break-even failure rate is where the "88% success rate" on trading sites comes from (Liberated Stock Trader puts it in its headline).
The skeptics are just as confident. In September 2026, Opulence Alpha tested double bottoms from 1995 through August 2026 and found that over the following month, those stocks beat the same day's median stock 50 times in 100. Their verdict: "No edge."
My data comes from StockDataAnalytics, the systematic stock pattern detection platform I built. I built the detection rules from common standards for this pattern and developed a scoring model that scores every detection with a quality score of 0 to 40. Every night StockDataAnalytics scans about 6,000 NYSE and NASDAQ stocks for 16 bullish chart patterns and scores each detection. Based on the data collected we estimate win probability, recommend a stop level and a target level. (A sample of today's detections is on the live double bottom page.)
Key findings:
- The score only matters at the top. Scores of 20 to 33 won 50% to 52%; 34 and up won 56.8%.
- Quiet bases were the weakest, and a heavy-volume second low cut stop-outs in every market regime.
- Waiting for the neckline buys nothing on average.
- The textbook W barely matters. Lows matched within 1% did no better than lows 6% to 10% apart.
- Day one predicts the trade, too late to act on. From the day-one close onward, strong and weak first days earned about the same.
How does the double bottom perform unfiltered?
Unfiltered, it's a coin flip. Of 157,787 trades, 50.4% closed above the entry price two weeks later and 46.9% beat the market. The average trade returned +0.23%.
The scanner's definition matters here. It looks for two swing lows 20 to 60 trading days apart, the second within 4 ATR of the first (ATR, average true range, is a stock's typical daily move). It does not require a neckline break. Only about 12% of these trades had closed above the neckline when they were signalled. This product behavior is intentional, as we want our clients to enter a pattern early.
| Trades | Win Rate | Market Beat | Trade Return | Hit Target First | Stopped Out | |
|---|---|---|---|---|---|---|
| All double bottoms, Jan 1 to Sep 30, 2026 | 157,787 | 50.4% | 46.9% | +0.23% | 53.9% | 17.4% |
Win rate: the stock closed above its entry price (the recommendation-day open) ten trading days later. Market beat: the trade's return beat the index over the same window (ONEQ for NASDAQ, DIA for NYSE). Trade return: the simulated trade with the scanner's own stop and target, closed at the end of the window if neither is hit.
The median stop sat about 10% below entry; the median target, about 4.7% above. The simulation asks for a small gain and allows a large loss. Read any target-hit rate with that in mind.
How does quality score affect double bottom win rate?
Only at the top. The quality score runs from 0 to 40 in three parts: Structure (0 to 15), Volume (0 to 12) and Breakout readiness (0 to 13). This table uses the 122,985 trades that scored 20 or higher.
| Quality Score | Trades | Win Rate | Market Beat | Trade Return |
|---|---|---|---|---|
| 20 to 24 | 39,690 | 50.2% | 47.3% | +0.18% |
| 25 to 29 | 52,282 | 50.9% | 46.7% | +0.26% |
| 30 to 33 | 25,077 | 52.0% | 47.0% | +0.37% |
| 34 to 35 | 4,254 | 56.0% | 49.2% | +0.80% |
| 36 to 37 | 1,411 | 57.2% | 51.4% | +0.85% |
| 38 | 181 | 69.1% | 64.1% | +1.85% |
| 39 to 40 | 90 | 60.0% | 53.4% | +0.74% |
From 20 to 33 (95% of the table), the win rate rises by less than two points and the market beat rate doesn't move. The 5,936 trades at 34 and above won 56.8%, beat the market 50.3%, and returned +0.84% per trade. That edge is out of sample: the score model was fitted and tuned on data ending in March 2025. Scores of 38 to 40 hold only 271 trades, too few to trust.
What does day one tell you about a double bottom trade?
The strongest signal in the analysis is not a pattern specific signal at all: A first close in the top fifth of the day's range won 63.4%; a close in the bottom fifth won 39.8%. With about 25,000 trades per row, that 24-point gap is no accident.
| Day-1 Close in Range | Trades | Win Rate | Market Beat | Return from Entry | Day 1 Return | Return from the Day-1 Close |
|---|---|---|---|---|---|---|
| Bottom 20% | 27,372 | 39.8% | 37.6% | −1.95% | −2.55% | +0.64% |
| 20 to 40% | 24,452 | 46.3% | 42.9% | −0.63% | −1.19% | +0.57% |
| 40 to 60% | 22,699 | 51.1% | 46.8% | +0.33% | +0.08% | +0.25% |
| 60 to 80% | 23,210 | 56.7% | 51.9% | +1.67% | +1.34% | +0.34% |
| Top 20% | 25,175 | 63.4% | 57.7% | +3.19% | +2.68% | +0.50% |
Returns in this table hold the stock to the end of the two-week window, with no stop or target.
Once the first close is in, the remaining return is small in every band (+0.25% to +0.64%). The two ends had the most left: +0.64% after the weakest closes and +0.50% after the strongest, against +0.25% and +0.34% in the middle. Those gaps are a fraction of a point, so I wouldn't build a rule on them. Waiting a second day doesn't help either; even the strictest two-day confirmation I tested (705 trades, 82.3% win rate) had only +0.26% left after the Day 2 close. A strong first day tells you the trade has probably already worked. It says little about the next leg.
The open told a similar story. Gap-ups whose first-day low held above the prior close won 59.9% (17,728 trades); gap-ups that traded back through it won 46.9%.
What happens when a double bottom throws back?
Usually nothing bad. An advance is a close at least 1% above the close on the day before entry; a throwback is a return to within half a percent of that close afterward. Of the trades that advanced, 72.6% threw back (Bulkowski reports 65%), and 66.9% of those recovered.
| Path | Share | Win Rate | Market Beat | Trade Return |
|---|---|---|---|---|
| Clean advance | 20.3% | 97.1% | 88.4% | +3.69% |
| Threw back, recovered | 36.1% | 73.1% | 64.8% | +3.19% |
| Threw back, failed | 17.8% | 19.8% | 20.0% | −0.47% |
| Never advanced | 25.8% | 6.0% | 8.8% | −5.93% |
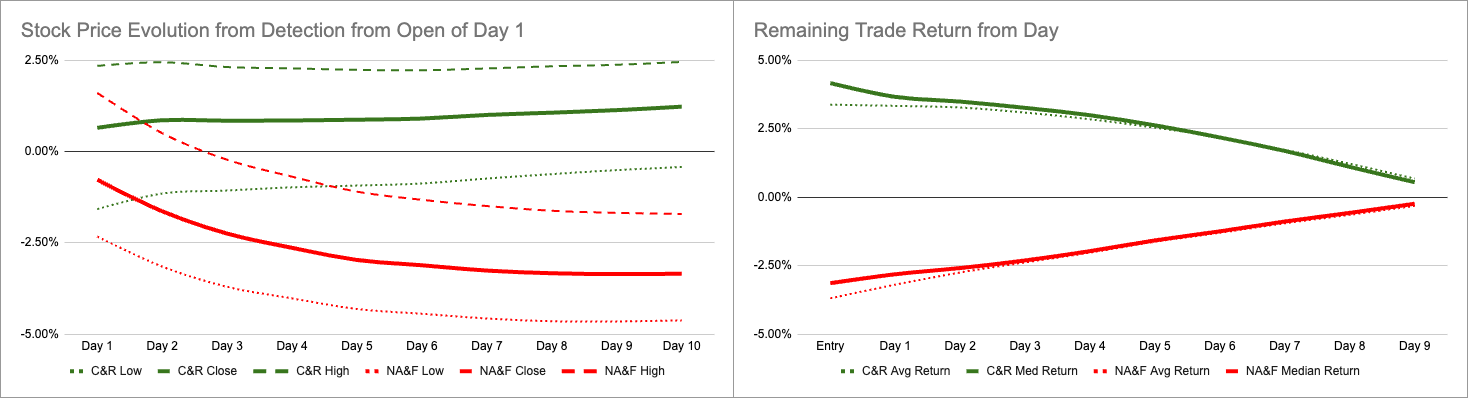
The bigger lesson sits in how the trades got there. I split them into the double bottoms that held their advance (clean advances plus recovered throwbacks - denoted as C&R, 56% of trades) and the ones that didn’t (never advanced plus failed throwbacks - denoted as NA&F), then tracked both day by day. The two split early. At the first close, the holders sat 0.64% above the entry price and the rest 0.78% below it, even though the weaker group’s average high that day was 1.6% above entry. From there the holders’ average low rose every day, while the other group’s average high fell every day; by Day 3 that high sat below the entry price. By the Day 5 close the groups were almost four points apart (+0.87% against −2.97%), and the holders still in the trade had +2.51% ahead of them, against −1.63% for the rest. That suggests that watching how the throwback plays out, and entering around Day 5 only in trades that look like the first group, could improve on buying every signal at the open. It’s important to call out that I haven’t tested this as a rule yet. Both groups are defined by how the trades ended, so the next step is to measure how well a stock’s position on Day 5 predicts which group it ends up in.
Which market regime works best for the double bottom?
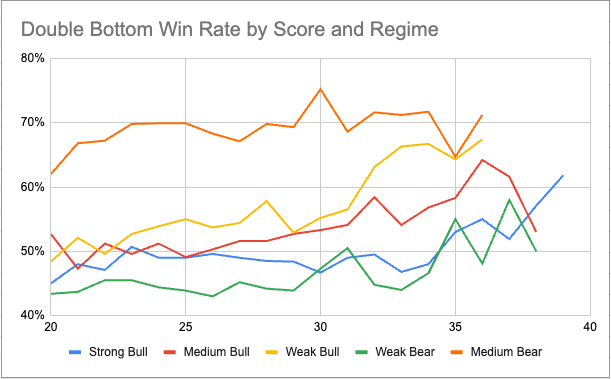
The medium bear zone, by a wide margin. The scanner tags each detection with a regime zone built from the index's trend and breadth, and zones change often (the typical stretch in 2026 lasted two trading days). This table uses the 120,982 trades that scored 20 or higher. It comes from the production detector, whose scores differ slightly from the build used in the rest of this article (8,175 trades scored 34 or higher here, against 5,936 in the score table).
| Market Regime | Trades | Win Rate | Market Beat | Trade Return | Stopped Out | Win Rate, Scores 20 to 33 | Win Rate, Scores 34+ |
|---|---|---|---|---|---|---|---|
| Strong Bull | 51,988 | 48.9% | 44.6% | +0.20% | 16.9% | 48.6% | 51.9% |
| Medium Bull | 33,456 | 52.1% | 52.0% | +0.26% | 18.4% | 51.7% | 59.1% |
| Weak Bull | 8,668 | 55.8% | 45.0% | +0.75% | 15.3% | 55.1% | 67.8% |
| Weak Bear | 17,937 | 45.1% | 45.3% | −0.43% | 20.1% | 44.8% | 51.5% |
| Medium Bear | 8,933 | 69.1% | 50.1% | +1.92% | 9.3% | 69.1% | 68.6% |
The medium bear zone won 69.1% at any score, with 9.3% stopped out and +1.92% per trade. Those are the numbers the tutorials promise. Even there, the market beat rate was 50.1% (the stocks rose because the market rose), and a high score added nothing: 69.1% below 34, 68.6% at 34 and up.
The score did its work in the weaker bull zones. In the weak bull zone, setups scoring 34 or higher won 67.8% against 55.1% below that; in the medium bull zone, 59.1% against 51.7%. In the strong bull zone, 43% of all signals, the gap was only 3.3 points (51.9% against 48.6%), and the market beat rate stayed under 47% either way. My read: when everything is rising, a stock that just made two lows isn't taking part. The weak bear zone was the worst at 45.1%, with 20.1% stopped out and a loss on average.
Which double bottom rules hold up?
I matched each published rule to the closest measurement the detector records and split all 157,787 trades into fifths of about 31,500. The same pattern is detected again on consecutive days, so these trades aren't independent; I set the bar accordingly. A rule is confirmed if the win-rate gap clears about four points and points the same way in at least four of the five regime zones. Three to four points is borderline.
| Textbook Rule | Source | What 157,787 Trades Show | Verdict |
|---|---|---|---|
| Volume should dry up through the base | Bulkowski | Fell 24%+: 47.2%. Steady: 52.6% | Contradicts textbook |
| The second low should come on lighter volume | Bulkowski | Win rate flat. Heavy-volume second lows stopped out 14.6% vs 19.2% | Contradicts textbook |
| Wait for a close above the neckline | Bulkowski | Confirmed: 50.3%. A quarter to halfway back: 51.0% | Rejected as a general rule |
| The two lows should be close (0 to 6% apart) | Bulkowski | Within 1%: 51.9%. 6 to 10%: 51.3%. Over 15%: 46.6% | Not needed below 10% |
| The second low should undercut the first | O'Neil school | 1 to 5% lower: 52.9%. Over 5% higher: 48.9% | Borderline, supported |
| Look for a tall left side | Bulkowski | Tallest fifth: 45.5%, 21.4% stopped out | Rejected (volatility) |
| Stay out of the middle of the yearly range | Bulkowski | Middle: 51.6%. Neckline 27%+ below 52-week high: 46.9% | Mixed |
| MACD bullish divergence between the lows | Tutorials | 49.6% to 51.0%; opposite signs by regime | Flat |
The shape rules that cleared my bar did so only at the extremes, and the extremes are mostly volatile stocks. The stock's behavior around the W mattered more than its outline.
Should volume dry up as a double bottom forms?
No. Bases where volume fell more than 24% from the first half to the second won 47.2% and beat the market 43.3%, with 19.3% stopped out. Bases with steady volume won 52.6% and beat the market 48.9%. The falling-volume fifth trailed the steady fifth in all five regime zones, at almost the same average score (24.4 against 25.1). Bases where volume rose more than 29% also trailed, so the best bases simply kept trading normally. My interpretation: a base on vanishing volume is a stock nobody is in a hurry to buy.
The second low agrees. A second low on a volume spike (more than 1.57 times its prior 20 days) was stopped out 14.6% of the time, against 19.2% for a quiet one. That looks like capitulation. Those lows held more often.
Should you wait for a double bottom to break the neckline?
Not as a general rule. Confirmed entries won 50.3% and returned +0.06%, the lowest of any stage; entries a quarter to halfway back won 51.0% and returned +0.36%. By the time the neckline breaks, much of the 4% to 5% move the target asks for has already happened. (Opulence Alpha found confirmed patterns hit their target 50 times in 100, against 18 for forming ones. A confirmed pattern starts closer to its target.)
The regime flips the answer. In the two big bull zones, entries less than a quarter of the way back won 45% to 46%, against 50% to 53% for confirmed ones. In the medium bear zone, early entries won 71% and confirmed ones 51%. Chasing failed in four of five zones: stocks already more than 15.7% off their second low won 46.7%.
Do the two lows of a double bottom need to be at the same price?
No. Lows within 1% of each other won 51.9%; lows 6% to 10% apart won 51.3%. Only one signal in five had lows within 3%, so a strict 3% rule would discard four patterns in five for no measurable gain. On direction, a shallow undercut (second low 1% to 5% below the first) did best at 52.9%. A second low more than 5% higher, 40% of all signals, won 48.9%. The textbook W landed in the middle.
Does relative strength matter before a double bottom signal?
Yes. It was the most useful before-entry measure I found. Stocks lagging the market by more than 2.7% over the prior ten days won 46.5%; stocks leading by 3.6% to 7.9% won 53.5%, at the same average score. Stocks already ahead by more than 7.9% fell back to 49.3%.
Frequently Asked Questions About the Double Bottom Pattern
What is the success rate of the double bottom pattern?
In 157,787 trades from January to September 2026, the double bottom won 50.4% of the time unfiltered (a coin flip) and beat the market 46.9% of the time. Setups scoring 34 or higher won 56.8% of 5,936 trades. By market regime, the win rate ranged from 45.1% to 69.1%.
Is the 88% double bottom success rate real?
It measures something else. The 88% is Bulkowski's 12% break-even failure rate turned around, counted only on patterns that had already broken out; in our data, trades entered after the neckline break won 50.3%.
Is a double bottom throwback a bad sign?
No. 72.6% of advancing double bottom trades threw back, and 66.9% of those recovered to almost the same return as a clean advance. The bad sign is never advancing at all: a quarter of trades did that, averaging −5.93%.
Which market regime is best for the double bottom?
In 2026, the medium bear zone: 69.1% on 8,933 trades, with 9.3% stopped out. The weak bear zone was the worst at 45.1%.
How do I find stocks forming a double bottom today?
Current double bottom detections, with entry, stop, target and quality score, are on the live double bottom page.
What the data teaches about building a double bottom strategy
StockDataAnalytics publishes data; it does not give investment advice. These points summarize what the 2026 data showed, as inputs to weigh against your own risk limits and costs.
- The pattern alone carried no edge, matching Opulence Alpha's 31-year result.
- The score separated outcomes only at 34 and up, and only slightly in the strong bull zone.
- Bases that kept trading beat bases that went quiet. A heavy-volume second low cut stop-outs by 3 to 7 points in every regime.
- Stocks that had just started to outperform did best. Laggards and stocks already far ahead both trailed.
- Entry timing depended on the regime. Early entries were weakest in bull zones and strongest in the medium bear zone.
- The stop sat twice as far away as the target, and a quarter of all trades never advanced. Any sizing rule has to account for that quarter.
Methodology and limitations
Data. 157,787 double bottom detections on NYSE and NASDAQ stocks, January 1 to September 30, 2026, limited to trades whose entry price fell between the stop and the conservative target. The score, day-one and throwback results use 122,985 detections scoring 20 or higher, without that filter.
The score. Fitted on data before March 2024, tuned on March 2024 to March 2025, and tested on April 2025 to mid-March 2026 before deployment. From March 20, 2026 onward, the data is new to it.
Limits. My four-point bar is a rule of thumb for clustered trades, short of a formal test. The medium bear result rests on two short stretches of 2026. There are no transaction costs here, and I haven't yet tested how the before-entry signals combine.
Regimes. The regime table comes from the production detector: 120,982 detections scoring 20 or higher. Its scores differ slightly from the build used elsewhere in this article.
Reproducing the tests. A swing low is the lowest low of the five bars on either side. The detector looks for two swing lows 20 to 60 trading days apart, the second within 4 ATR of the first, above or below. The neckline is the highest high between them and must sit at least 2 ATR above the lower low. The signal fires within 10 bars of the second low, once price is at least 2% above it and no more than 10% above the neckline. Each trade enters at the open on the recommendation date and is judged on the close of the tenth trading day, counting the entry day. The win rate and market beat rate need only these rules and daily bars; the trade return also uses the scanner's stop and conservative target (median about 10% below and 4.7% above entry).
About StockDataAnalytics
StockDataAnalytics is a systematic stock pattern detection platform. It scans about 6,000 NYSE and NASDAQ stocks every night for 16 bullish chart patterns and emails the top-ranked setups before the open. Every recommendation is tracked with the same two-week simulation used here.
Daily signals · Start a free trial · Live double bottom detections
About the author
Rene Haase is the founder of StockDataAnalytics and Prismora Data. He spent three decades in data and engineering, much of it leading data platform and analytics teams. He holds economics degrees from Germany. He writes these articles because the data keeps disagreeing with the textbooks.
Disclaimer: This article is for educational purposes only and is not financial advice. StockDataAnalytics is not a registered investment advisor, and nothing here is a recommendation to buy or sell any security. Past performance does not guarantee future results. The statistics come from simulated trades and exclude commissions, slippage and taxes. Trading stocks involves risk, including loss of principal.
Related Articles
If you enjoyed this article, check out all pattern analysis articles.
Sources
- Bulkowski, Eve & Eve Double Bottoms
- Opulence Alpha, "Does a double bottom predict a rebound?" (September 25, 2026)
- Liberated Stock Trader, "Trading a Double Bottom Pattern for 88% Winning Trades"